
TL;DR Key Takeaways
TL;DR
- Bollinger Bands consist of a middle moving average and two standard deviation-based bands that expand and contract with market volatility.
- They help traders determine whether an asset is overbought (near the upper band) or oversold (near the lower band).
- Most platforms calculate Bollinger Bands automatically, so traders don’t need to do it manually.
- Bollinger Bands are ideal for identifying volatility shifts and potential reversals. Keltner Channels, on the other hand, use ATR-based bands for smoother trend analysis.
In this article, we’ll explore what Bollinger Bands are, how they’re calculated, and how they compare to Keltner Channels, another popular volatility indicator.
How Are Bollinger Bands Used in Trading?
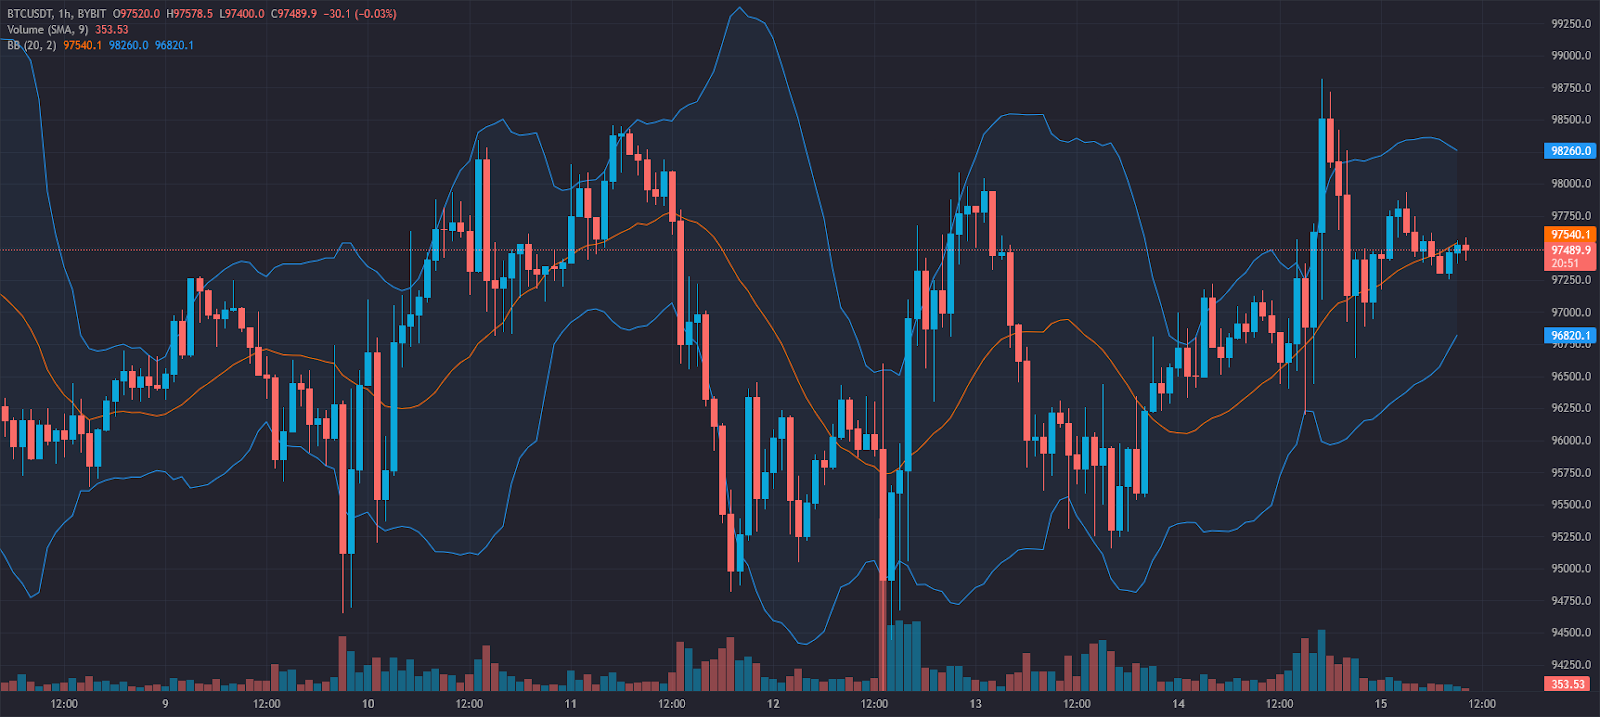
The Bollinger Bands indicator, developed by John Bollinger, is a widely used technical tool for measuring market volatility and potential trend reversals. It consists of:
- A simple moving average (SMA) in the center (typically a 20-period SMA)
- An upper band (SMA + 2 standard deviations)
- A lower band (SMA - 2 standard deviations)
This setup makes Bollinger Bands particularly useful for assessing price action in different market conditions. When the price:
- Touches the upper band – It signals that the asset might be overbought, potentially leading to a reversal or pullback.
- Touches the lower band – It suggests the asset might be oversold, indicating a possible buying opportunity.
- Bands widen – Increasing volatility; often occurs during breakouts.
- Bands contract – Decreasing volatility, often preceding significant price movements.
Trading Strategies Using Bollinger Bands
1. Bollinger Band Squeeze
A squeeze occurs when the bands contract, signaling a period of low volatility. This often precedes a breakout, making it an excellent time for traders to prepare for significant price movements.
2. Breakout Strategy
When the price moves outside the bands, it often indicates strong momentum. Traders look for breakouts followed by confirmations from other indicators to enter trades.
3. Mean Reversion Trading
Since price tends to revert to the middle band (SMA), traders use this tendency to buy near the lower band and sell near the upper band, especially in range-bound markets.
Traders use Bollinger Bands to refine their strategies by identifying breakouts, trend reversals, and price consolidations. The indicator helps determine entry and exit points, especially when used alongside confirmation tools like the Relative Strength Index (RSI) or Moving Average Convergence Divergence (MACD).
How Bollinger Bands Work + Formula
Curious about the math behind Bollinger Bands? Follow these steps:
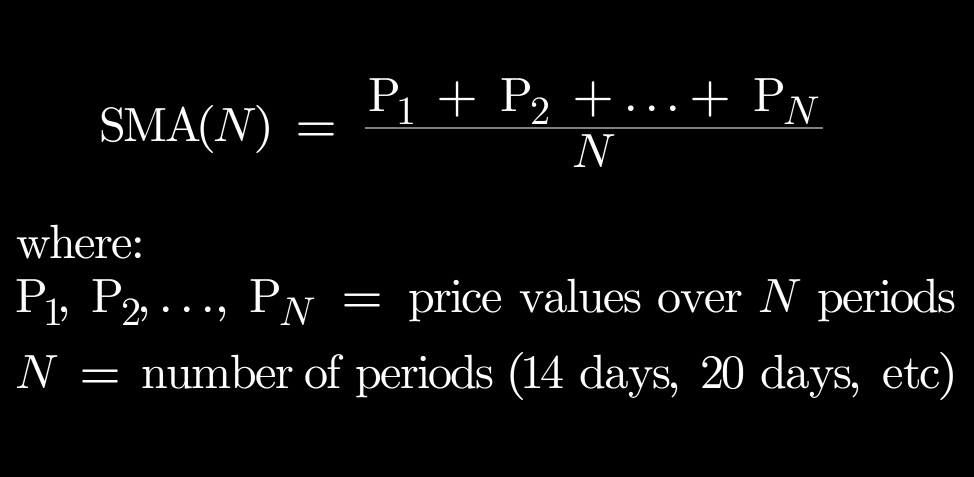
- Compute the Simple Moving Average (SMA):
- Determine the Standard Deviation (SD):
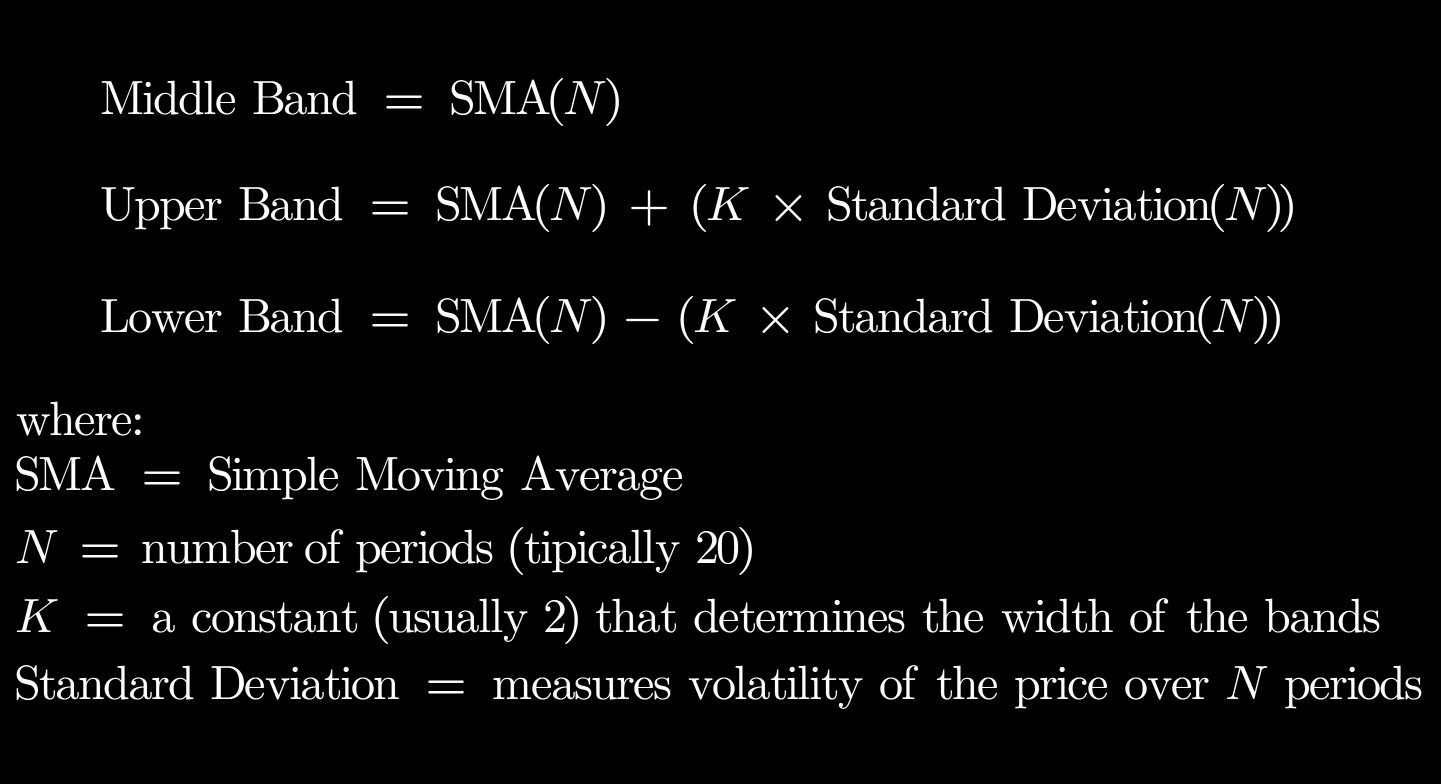
- Calculate the Upper Band:
- Calculate the Lower Band:
Tealstreet automatically plots Bollinger Bands, which are accesible via its Indicators dropdown, removing the need for manual calculations. This simplifies market analysis, allowing traders to focus on interpreting price action effectively.
Bollinger Bands vs. Keltner Channels
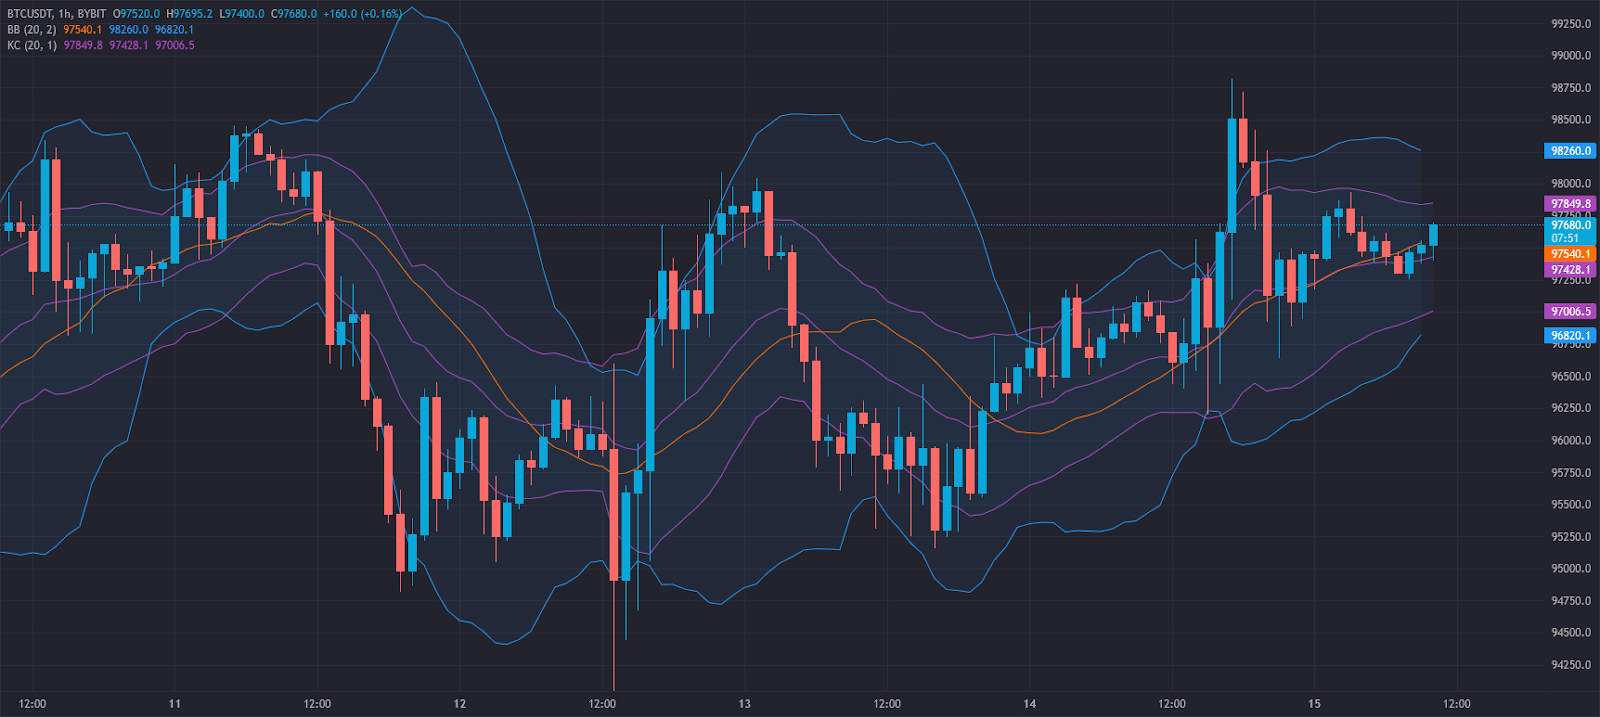
Many traders compare Bollinger Bands to Keltner Channels because both measure volatility and provide trading signals. However, there are key differences:
- Bollinger Bands use standard deviations, making them highly responsive to price volatility.
- Keltner Channels use the Average True Range (ATR), offering a smoother representation of price trends.
Key Differences:
- Bollinger Bands expand and contract dynamically based on market volatility, leading to more frequent trading signals.
- Keltner Channels provide steadier bands, reducing the impact of price spikes.
- Best Use Case: Bollinger Bands are preferred for breakout trading and mean reversion strategies, while Keltner Channels are better for trend-following strategies.
Both indicators are valuable, and some traders even combine them to enhance their decision-making process.
Stay Ahead of the Market
with Tealstreet
🚀 FAQs
1. Why are Bollinger Bands important for traders?
Bollinger Bands help traders identify overbought and oversold conditions, spot volatility shifts, and predict breakouts.
2. How do traders interpret Bollinger Bands to identify buy or sell signals?
- A price near the lower band suggests a potential buying opportunity.
- A price near the upper band indicates possible selling pressure or overbought conditions.
- Bands tightening often precedes major price moves.
3. What are the common pitfalls of relying solely on Bollinger Bands?
Bollinger Bands alone don’t confirm trend direction. False signals can occur, so they work best when combined with RSI, MACD, or other technical indicators.
4. Are Bollinger Bands effective in all markets?
Bollinger Bands are versatile and work in crypto, forex, stocks, and commodities markets, but they are most effective in volatile conditions.