
TL;DR Key Takeaways
TL;DR
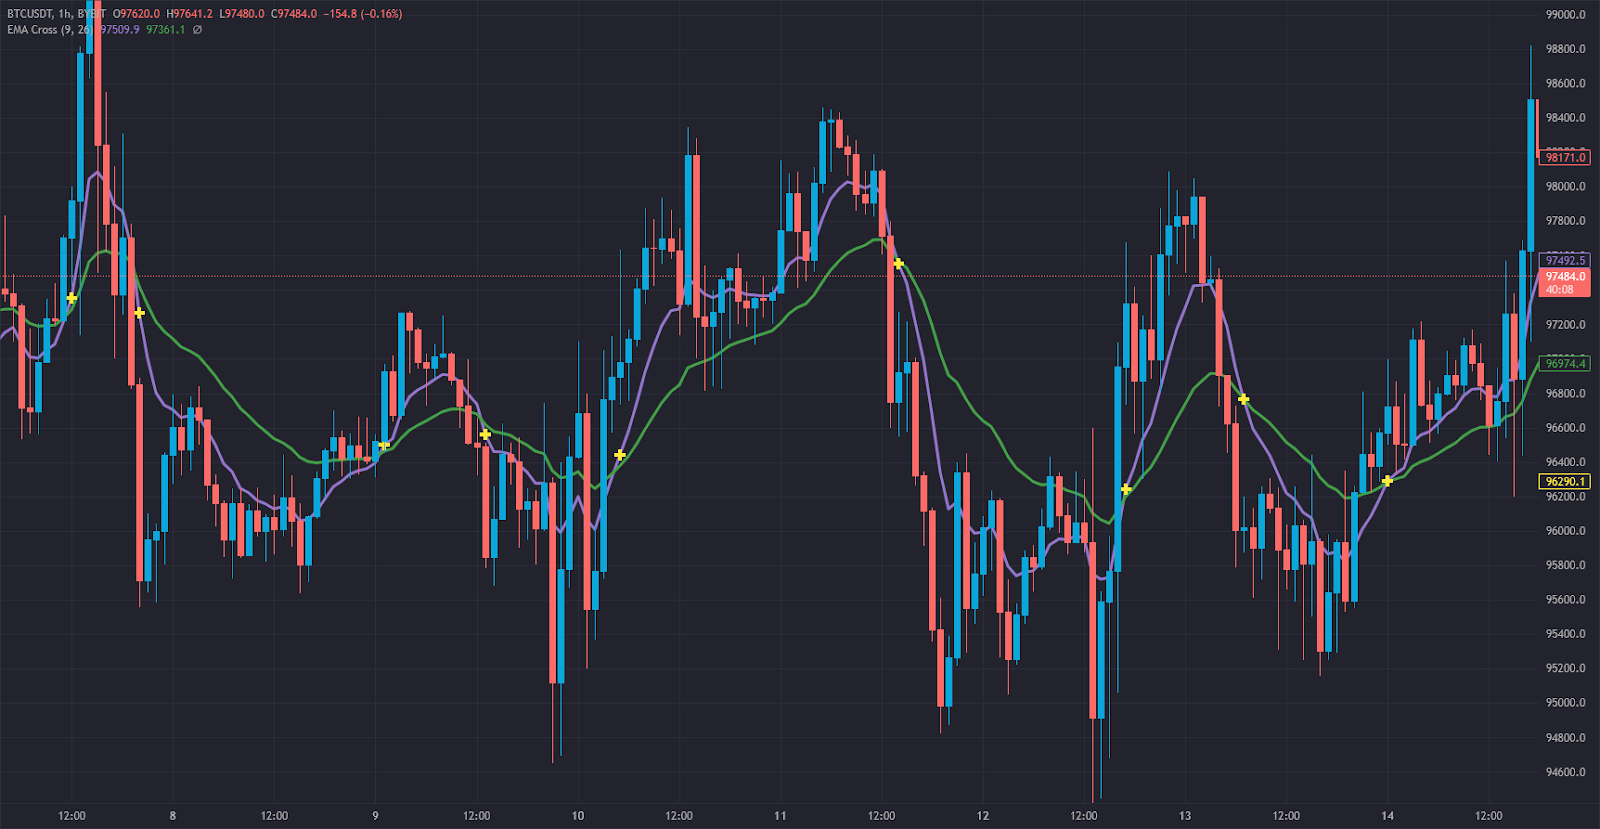
- EMA Cross, or Exponential Moving Average Cross, is a trading strategy that uses two EMAs to identify trend direction and potential trade signals.
- The two key EMAs are typically a short-term EMA (e.g., 9-day) and a long-term EMA (e.g., 50-day).
- The Golden Cross occurs when the short-term EMA crosses above the long-term EMA, signaling a bullish trend.
- The Death Cross occurs when the short-term EMA crosses below the long-term EMA, indicating a bearish trend.
- EMA Cross is ideal for trend-following strategies, while Simple Moving Averages (SMA) offer a smoother long-term trend outlook.
In this article, we’ll explore what the EMA Cross indicator is, how it’s calculated, and how it compares to SMAs, another widely used moving average strategy.
How Is the EMA Cross Used in Trading?
The EMA Cross strategy is a widely used method for determining trend direction and momentum shifts in financial markets. The indicator relies on the crossover of two Exponential Moving Averages:
- Short-Term EMA (Fast EMA): A faster-moving average, such as the 9-day or 20-day EMA, that reacts quickly to price changes.
- Long-Term EMA (Slow EMA): A slower-moving average, such as the 50-day or 200-day EMA, that smooths out long-term trends.
Key Trading Signals from the EMA Cross:
- Golden Cross (Bullish Signal): Occurs when the short-term EMA crosses above the long-term EMA, suggesting a potential upward trend.
- Death Cross (Bearish Signal): Happens when the short-term EMA crosses below the long-term EMA, indicating a possible downtrend.
- EMA Divergence: If the gap between the two EMAs widens, it suggests strong momentum in the current trend.
- EMA Convergence: When the two EMAs move closer together, it signals potential market consolidation or trend reversal.
The EMA Cross strategy helps traders refine their entries and exits by identifying trend shifts early. It is commonly used in combination with volume indicators like Relative Strength Index (RSI) and Moving Average Convergence Divergence (MACD) for confirmation.
How the EMA Cross Works + Formula
Curious about the math behind EMA? To calculate the Exponential Moving Average, follow these steps:
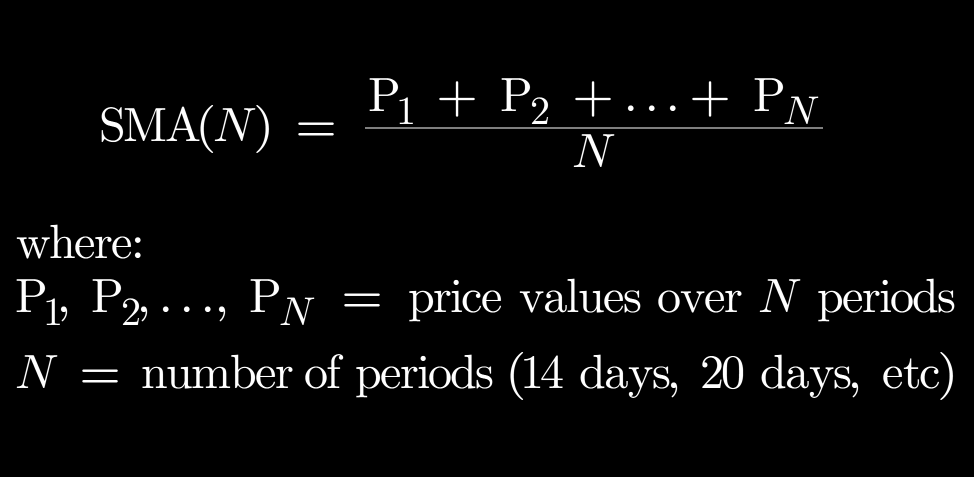
- Calculate the Simple Moving Average (SMA) for the first period:
- Determine the Smoothing Factor (Multiplier)
- Apply the EMA Formula:
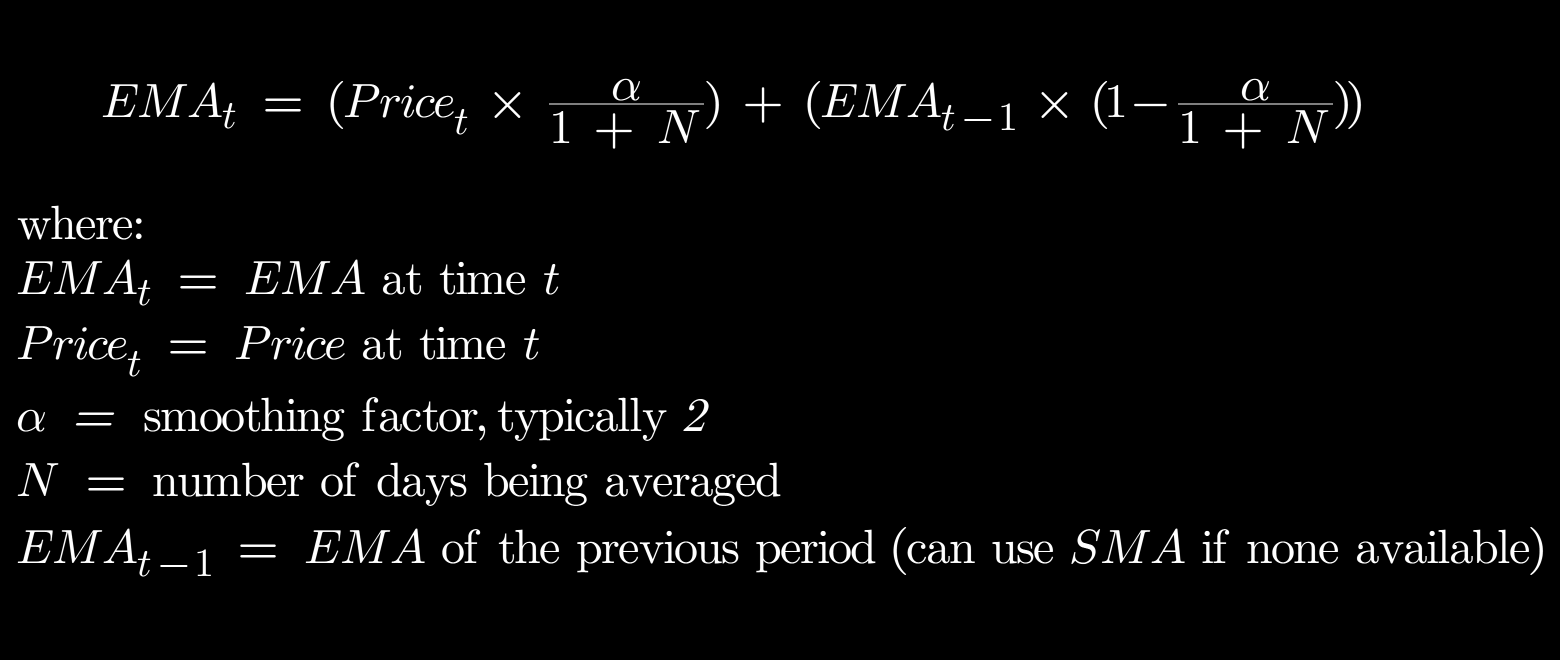
The EMA formula places more weight on recent prices, making it more responsive to price fluctuations than the SMA.
How to Identify EMA Cross Signals:
- Plot both the short-term and long-term EMA on the price chart.
- Watch for crossovers to indicate potential buying or selling opportunities.
- Confirm signals with additional indicators or chart patterns to reduce false positives.
Tealstreet automatically plots EMAs, easily accesible via its Indicators dropdown, simplifying the process for traders.
EMA Cross vs. Simple Moving Average (SMA)
Many traders compare the EMA Cross to Simple Moving Averages (SMA) since both are moving average-based strategies. However, there are important distinctions:
Key Differences:
- EMA reacts faster to price movements due to its weighted calculation, while SMA lags more as it treats all data points equally.
- EMA Cross provides earlier signals, making it better suited for short-term trading strategies, whereas SMA is ideal for long-term trend confirmation.
- Best Use Case: EMA Cross is preferred for momentum and trend-following strategies, while SMA is better for investors looking for long-term price trends.
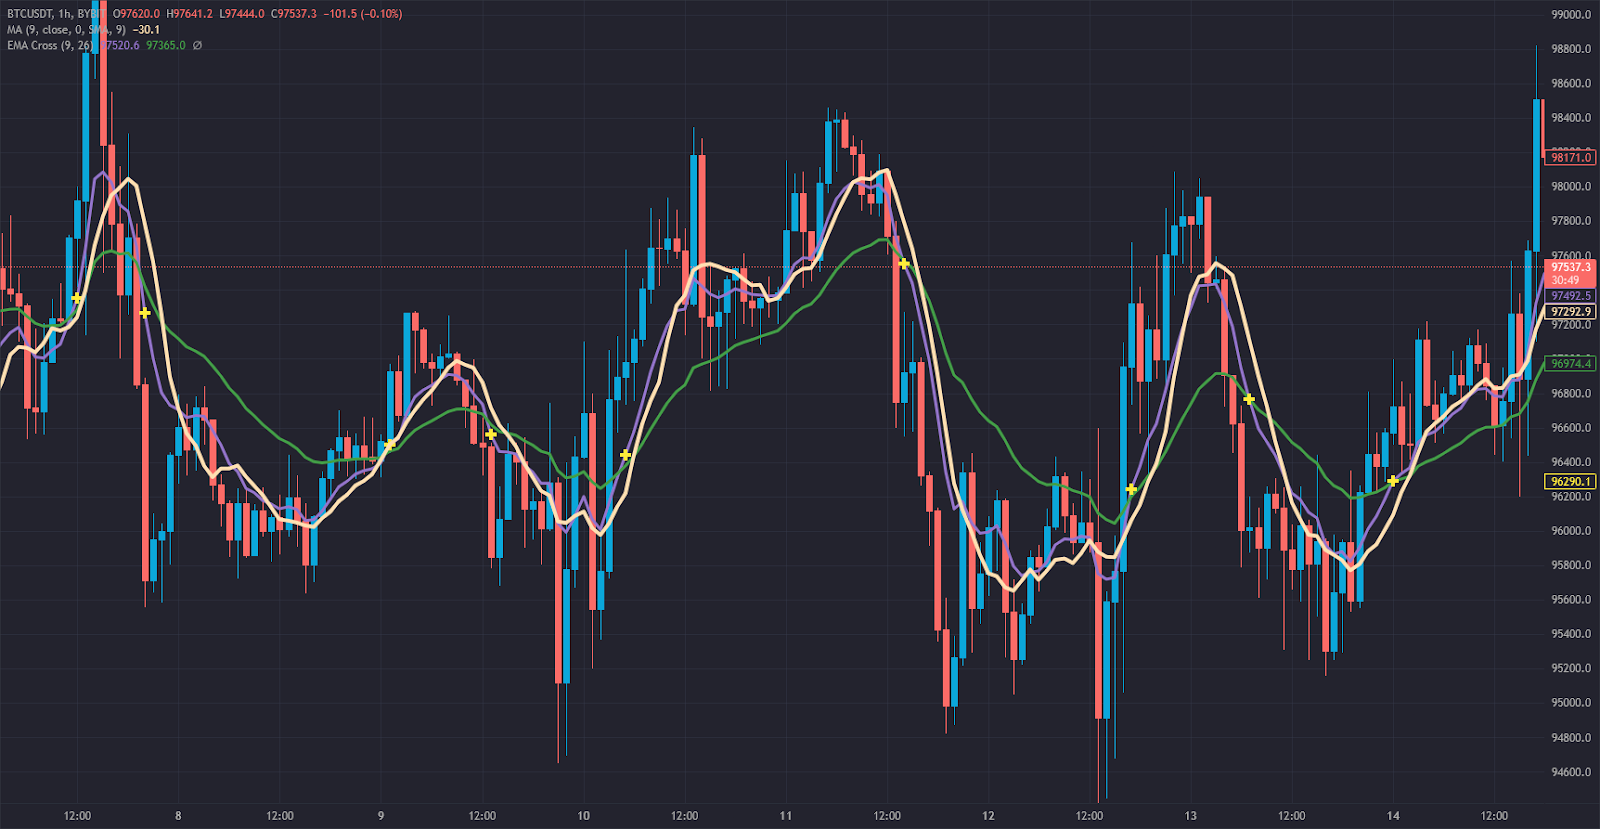
Both indicators are valuable, and traders often combine them for a comprehensive strategy.
Stay Ahead of the Market
with Tealstreet
🚀 FAQs
1. Why is the EMA Cross important for traders?
The EMA Cross helps traders identify trend changes early, allowing them to enter trades with strong momentum and minimize lag compared to traditional moving averages.
2. How do traders interpret the EMA Cross to identify buy or sell signals?
- A Golden Cross (short-term EMA crossing above long-term EMA) suggests a bullish entry.
- A Death Cross (short-term EMA crossing below long-term EMA) signals a bearish trend.
- The distance between EMAs indicates momentum strength.
3. What are the common pitfalls of using the EMA Cross strategy?
- False signals in choppy markets can lead to whipsaws.
- Lagging nature in volatile conditions may cause late entries.
- Works best when combined with volume indicators like RSI or MACD for confirmation.
4. Is the EMA Cross effective in all markets?
Yes, the EMA Cross strategy works in crypto, forex, stocks, and commodities markets. It is particularly useful for identifying long-term trend shifts and momentum changes.