
TL;DR Key Takeaways
TL;DR
- Ichimoku Cloud, or Ichimoku Kinko Hyo, is a comprehensive trading indicator that provides insights into trend direction, support/resistance levels, and momentum.
- It consists of five components: Tenkan-sen, Kijun-sen, Senkou Span A, Senkou Span B, and the Chikou Span.
- The Ichimoku Cloud helps traders determine whether an asset is in a bullish or bearish trend and when to enter or exit trades.
- Most platforms calculate the Ichimoku Cloud automatically, so traders don’t need to compute it manually.
- The Ichimoku Cloud is ideal for trend-following strategies, while Moving Averages provide simpler trend confirmation signals.
In this article, we’ll explore what the Ichimoku Cloud is, how it’s calculated, and how it compares to Moving Averages, another popular trend-following indicator.
How Is the Ichimoku Cloud Used in Trading?
The Ichimoku Cloud indicator, developed by Goichi Hosoda in the late 1960s, is a versatile trading tool designed to provide a holistic view of price action. It consists of five key components:
- Tenkan-sen (Conversion Line) – A short-term moving average calculated as the midpoint of the highest high and lowest low over the past 9 periods.
- Kijun-sen (Base Line) – A medium-term moving average using the same calculation over the past 26 periods.
- Senkou Span A (Leading Span A) – The average of the Tenkan-sen and Kijun-sen, plotted 26 periods ahead.
- Senkou Span B (Leading Span B) – The midpoint of the highest high and lowest low over the past 52 periods, plotted 26 periods ahead.
- Chikou Span (Lagging Span) – The current closing price plotted 26 periods behind.
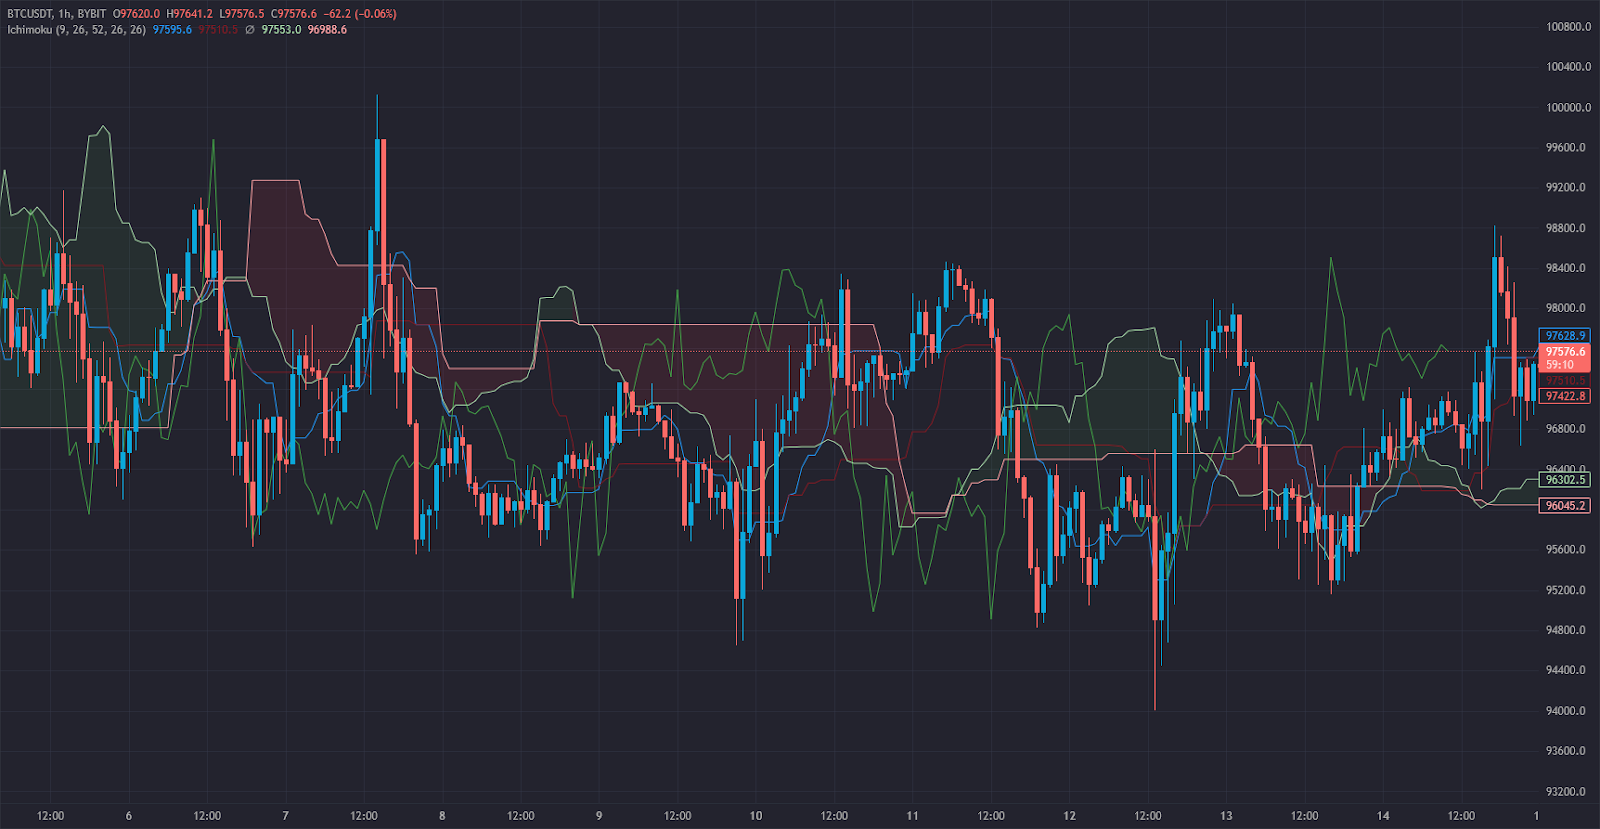
This setup allows traders to quickly assess market sentiment and identify potential trade opportunities.
Key Trading Signals from the Ichimoku Cloud:
- Price above the Cloud → Strong bullish trend.
- Price below the Cloud → Strong bearish trend.
- Price inside the Cloud → Consolidation or indecision.
- Bullish Cross (Tenkan-sen crosses above Kijun-sen) → Potential buying opportunity.
- Bearish Cross (Tenkan-sen crosses below Kijun-sen) → Potential selling opportunity.
Traders use the Ichimoku Cloud to refine their strategies by confirming trends, identifying breakouts, and setting support/resistance levels.
How the Ichimoku Cloud Works + Formula
Curious about the math behind Ichimoku Cloud? Follow these steps:
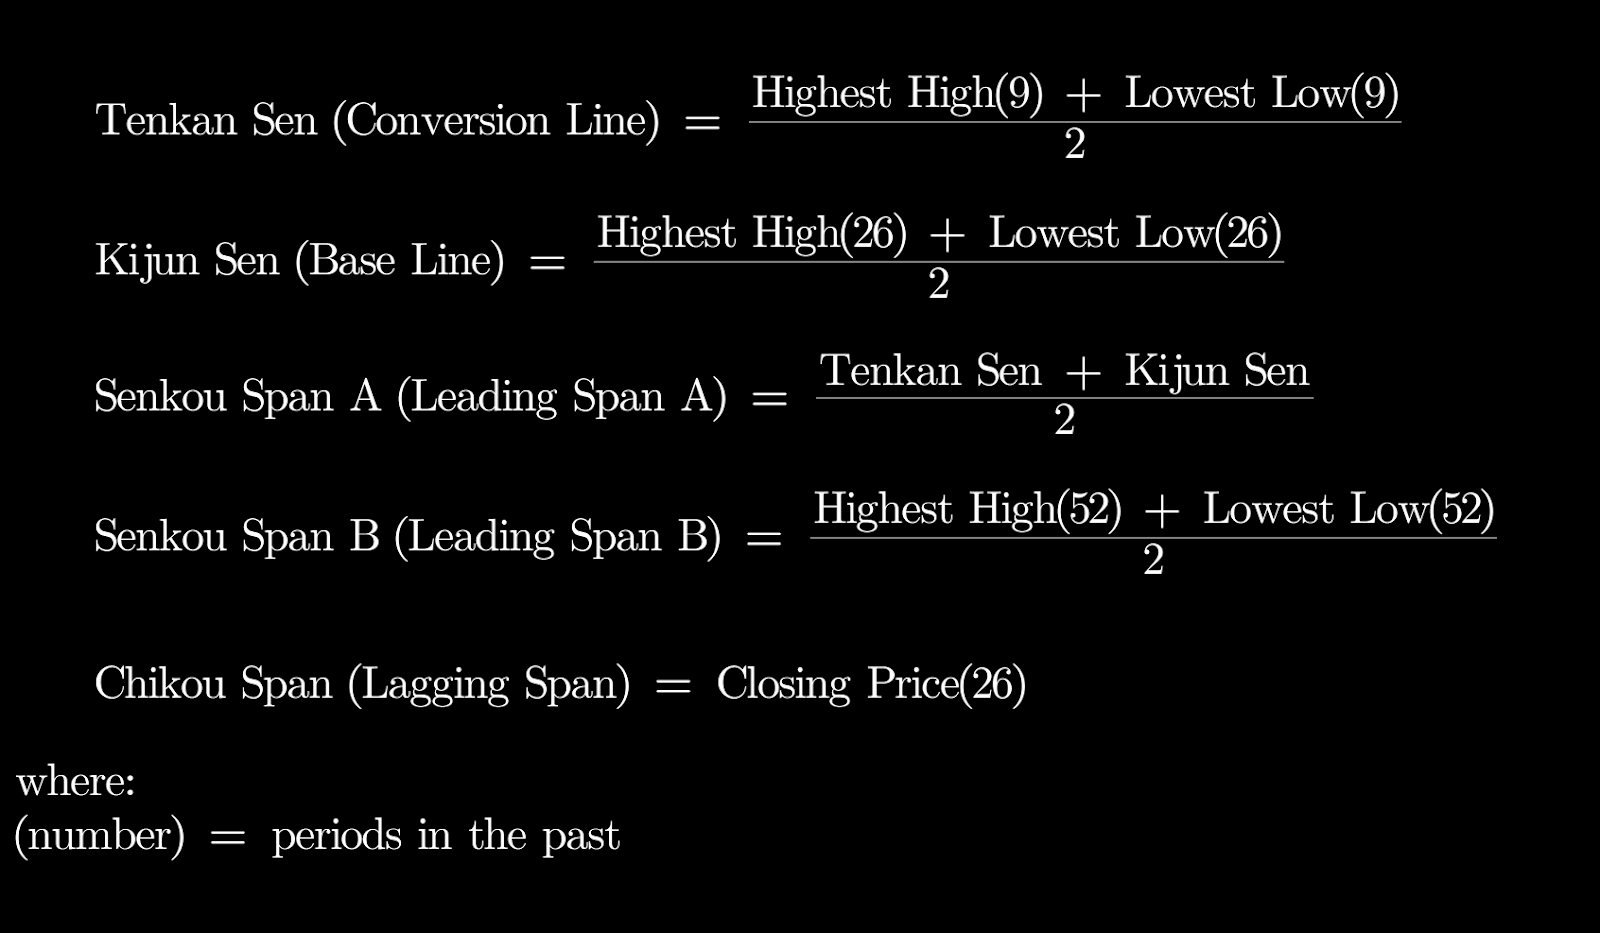
- Compute the Tenkan-sen (Conversion Line)
- Compute the Kijun-sen (Base Line)
- Compute the Senkou Span A (Leading Span A), plotted 26 periods ahead
- Compute the Senkou Span B (Leading Span B), plotted 26 periods ahead
- Compute the Chikou Span (Lagging Span), plotted 26 periods behind
Tealstreet automatically plots the Ichimoku Cloud, easily accesible via its Indicators dropdown, allowing traders to focus on interpretation rather than manual calculation.
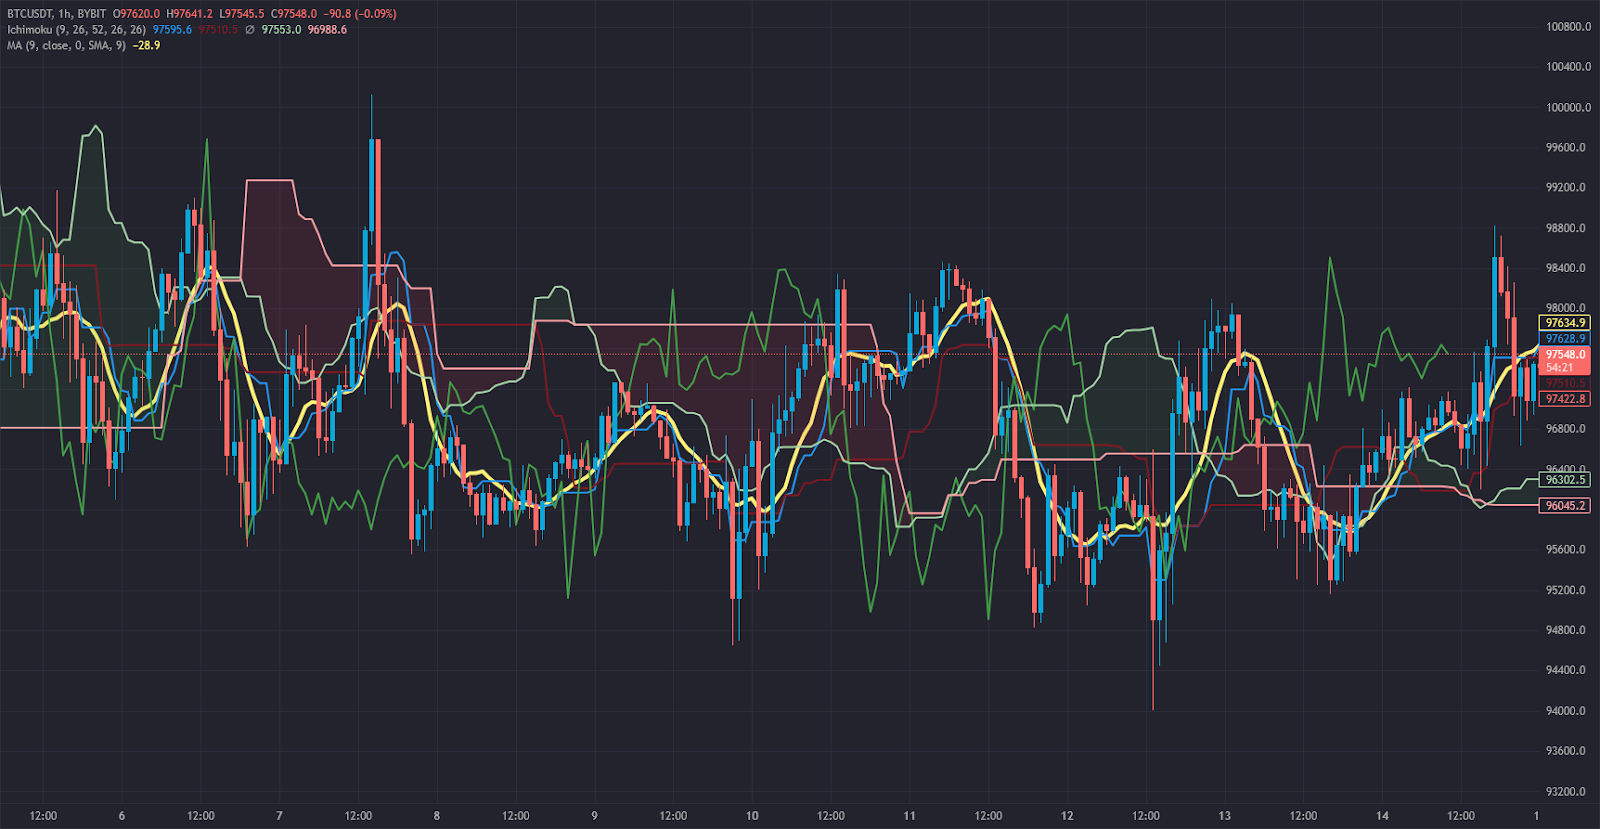
Ichimoku Cloud vs. Moving Averages
Many traders compare the Ichimoku Cloud to traditional Moving Averages since both indicators help identify trends. However, there are key differences:
- Ichimoku Cloud provides a more comprehensive view of price action, including trend direction, support/resistance, and momentum.
- Moving Averages smooth out price data to identify general trend direction but lack additional insights like projected support/resistance levels.
Key Differences:
- Ichimoku Cloud identifies trends and potential reversals earlier due to its multi-component system.
- Moving Averages provide simpler trend confirmation but may lag behind real-time price action.
- Best Use Case: The Ichimoku Cloud is preferred for trend-following and momentum trading, while Moving Averages are useful for trend confirmation and long-term positioning.
Both indicators are valuable, and some traders use them together to enhance their analysis.
Stay Ahead of the Market
with Tealstreet
🚀 FAQs
1. Why is the Ichimoku Cloud important for traders?
The Ichimoku Cloud provides a comprehensive view of price action, helping traders identify trends, support/resistance levels, and momentum shifts in a single glance.
2. How do traders interpret the Ichimoku Cloud to identify buy or sell signals?
- A bullish crossover occurs when Tenkan-sen crosses above Kijun-sen, signaling a potential buying opportunity.
- A bearish crossover occurs when Tenkan-sen crosses below Kijun-sen, indicating a potential sell signal.
- Price moving above or below the Cloud confirms strong bullish or bearish trends, respectively.
3. What are the common pitfalls of relying solely on the Ichimoku Cloud?
The Ichimoku Cloud works best in trending markets and may generate false signals in ranging or choppy conditions. Combining it with other indicators, like RSI or MACD, improves accuracy.
4. Is the Ichimoku Cloud effective in all markets?
Yes, the Ichimoku Cloud is versatile and works in crypto, forex, stocks, and commodities markets. It is particularly useful in highly liquid and trending environments.