
TL;DR Key Takeaways
TL;DR
- MACD, or Moving Average Convergence Divergence, shows the relationship between two moving averages of an asset’s price.
- It’s used to determine if a trend is strengthening or weakening and to identify buy or sell signals.
- Most platforms calculate MACD automatically, so traders don’t need to do it manually.
- MACD is ideal for tracking momentum shifts. RSI, on the other hand, measures overbought and oversold conditions.
In this article, we’ll explore what MACD is, how it’s calculated, and how it compares to RSI, another popular indicator.
How is MACD Used in Trading?
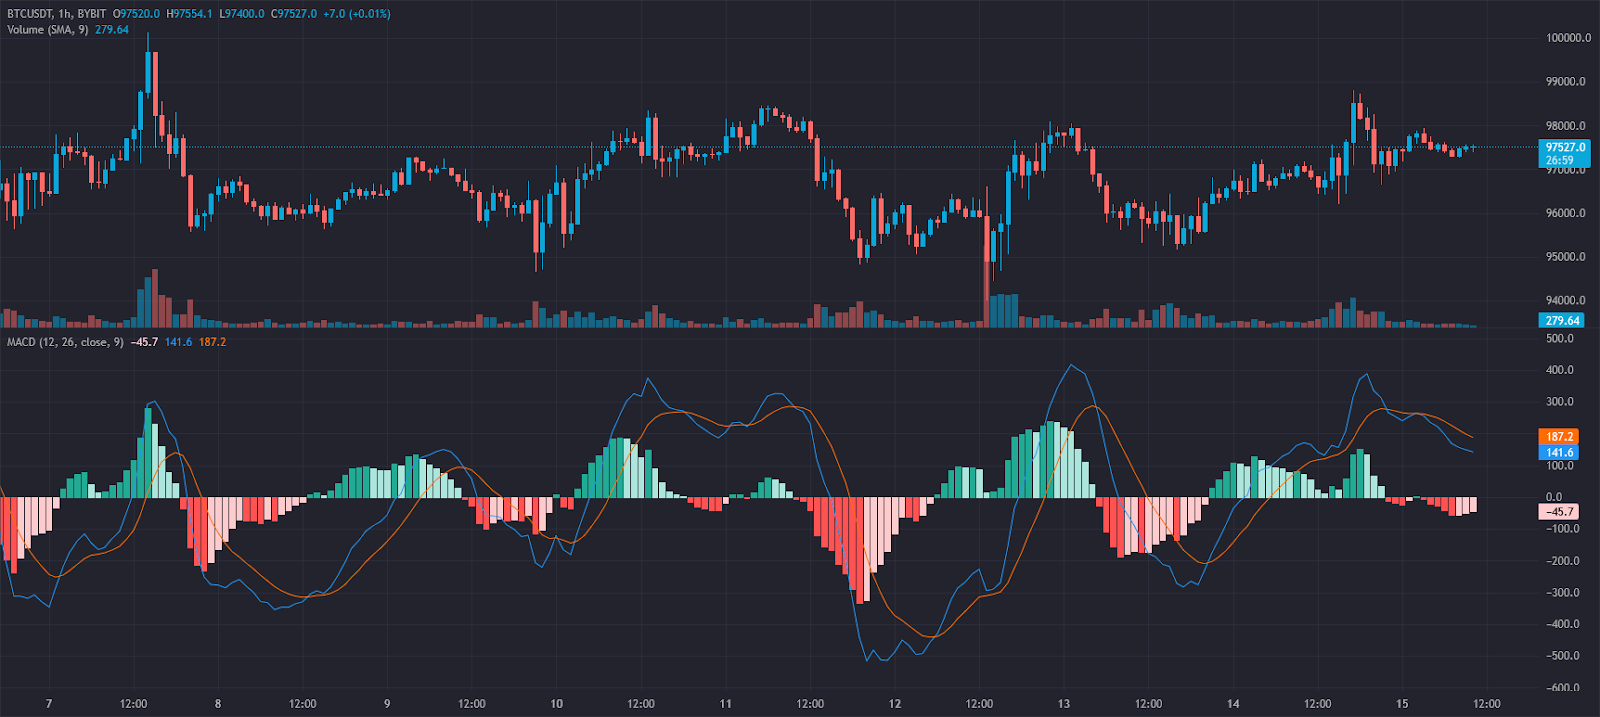
The Moving Average Convergence Divergence (MACD) is a momentum-based indicator that helps traders analyze trend strength and potential reversals. It consists of three components:
- MACD Line - The difference between the 12-day and 26-day exponential moving averages (EMAs).
- Signal Line - A 9-day EMA of the MACD line, used to identify trade signals.
- Histogram - A graphical representation of the distance between the MACD line and the signal line.
This distinction makes MACD particularly useful for gauging market sentiment over short to medium time frames. When the MACD line crosses:
- Above the Signal Line - It signals bullish momentum, indicating a potential buy opportunity.
- Below the Signal Line - It reflects bearish momentum, suggesting a possible selling opportunity.
Divergence and Convergence
One of the most powerful signals in MACD trading is divergence and convergence:
- Bullish Divergence: When price makes a lower low while MACD makes a higher low, indicating weakening downward momentum.
- Bearish Divergence: When price makes a higher high but MACD forms a lower high, signaling potential trend reversal to the downside.
Traders use MACD to confirm trends and anticipate reversals. Let’s consider an example of a trader using MACD for better decision-making. While the indicator helps this trader identify trends, it also serves a more strategic purpose: detecting momentum shifts before price action confirms them.
Example:
Imagine a trader monitoring Bitcoin’s daily chart. The MACD line crosses above the signal line while the histogram turns positive—this indicates increasing momentum, making it a good buy signal. Later, when the MACD line crosses below the signal line, the trader considers selling to lock in profits before a downturn.
How MACD Works + Formula
Curious about the math behind MACD? Here’s a breakdown of the process:
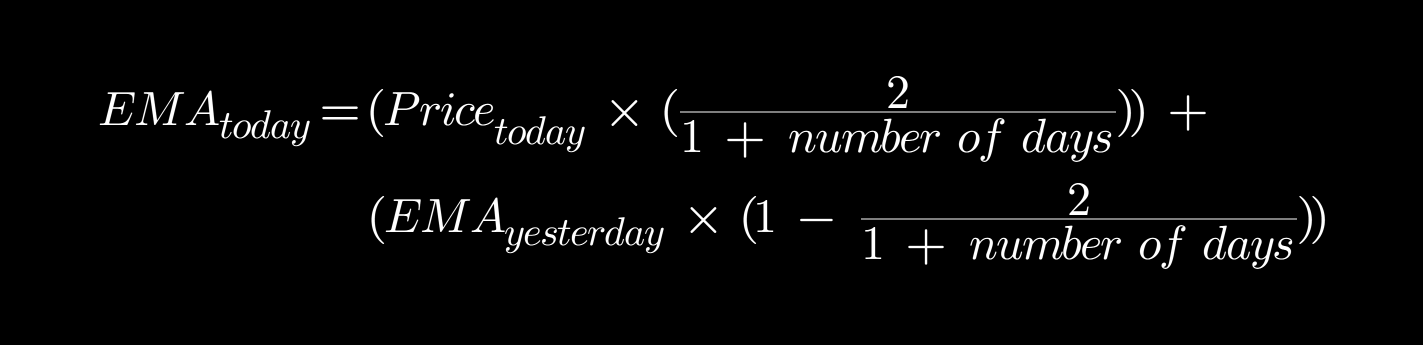
- Calculate the 12-day EMA - This gives more weight to recent prices for responsiveness.
- Calculate the 26-day EMA - A longer-term trend filter.
- Find the MACD Line - Subtract the 26-day EMA from the 12-day EMA.
- Determine the Signal Line - Compute the 9-day EMA of the MACD Line.
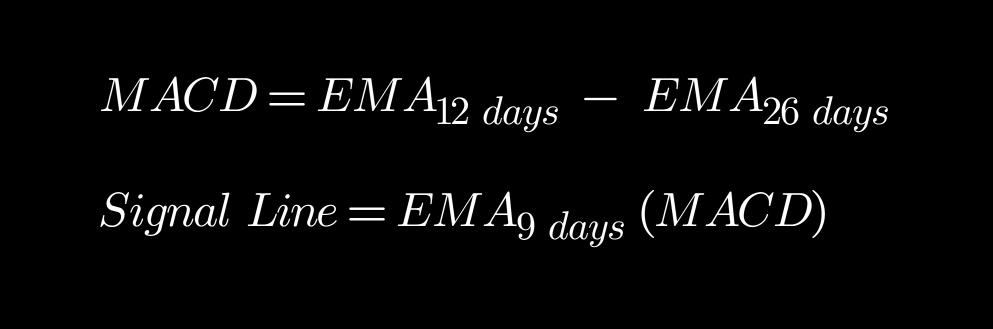
- Compute the Histogram - Subtract the Signal Line from the MACD Line.
This way, the MACD formula provides a clear view of trend direction and strength.
Tealstreet easily displays MACD, accesible via its Indicators dropdown, simplifying interpretation for traders. The histogram visually represents momentum shifts, making it easier to act on trading signals.
MACD Trading Strategies
1. MACD Crossover Strategy
Traders look for MACD line crossovers with the signal line:
- Bullish Crossover: MACD crosses above the signal line, signaling a buy.
- Bearish Crossover: MACD crosses below the signal line, indicating a sell.
2. MACD Histogram Reversal
Traders observe changes in the histogram to detect trend weakening before price action confirms it.
3. Zero Line Cross
A cross above the zero line suggests an uptrend, while a cross below indicates a downtrend.
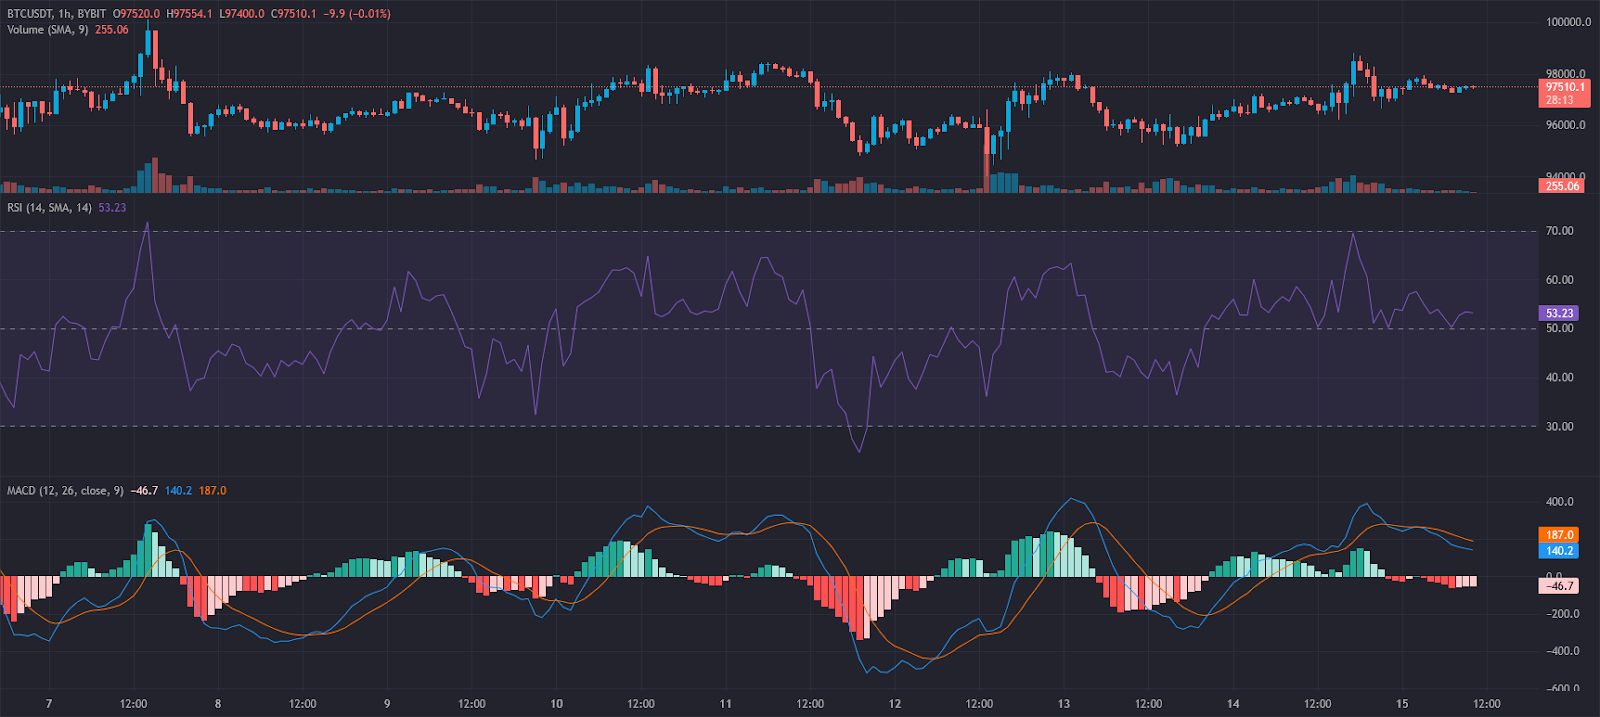
MACD vs. RSI
Many traders struggle to choose between MACD and RSI (Relative Strength Index). Both are valuable, but they serve different purposes:
- MACD measures trend momentum and direction.
- RSI identifies overbought or oversold conditions.
Key Differences:
- MACD is best for detecting trend shifts and momentum changes.
- RSI helps traders determine whether an asset is overbought (above 70) or oversold (below 30).
- MACD is useful for confirming trends, while RSI is more effective for spotting reversals.
When to Use Each:
- MACD is ideal for traders looking to ride trends and gauge momentum.
- RSI is useful when assessing whether an asset is likely to reverse.
Since both tools provide unique insights, many traders use them together to increase accuracy.
Stay Ahead of the Market
with Tealstreet
🚀 FAQs
1. Why is MACD important for traders?
MACD helps traders identify momentum shifts and trend direction, making it easier to time entries and exits effectively.
2. How do traders interpret MACD to identify buy or sell signals?
When the MACD line crosses above the signal line, it suggests a buying opportunity. A cross below signals a potential sell.
3. What are the common pitfalls of relying solely on MACD?
MACD can generate false signals, especially in ranging markets. It works best when combined with other indicators like RSI.
4. Are there specific markets where MACD is more effective?
MACD is highly effective in trending markets but less reliable in sideways or choppy conditions.
5. Can MACD be used in different timeframes?
Yes, MACD works across different timeframes, but shorter timeframes may produce more false signals. Longer timeframes provide stronger confirmation.
By mastering MACD, traders can enhance their decision-making and refine their strategies for better results in the market.