
TL;DR Key Takeaways
TL;DR
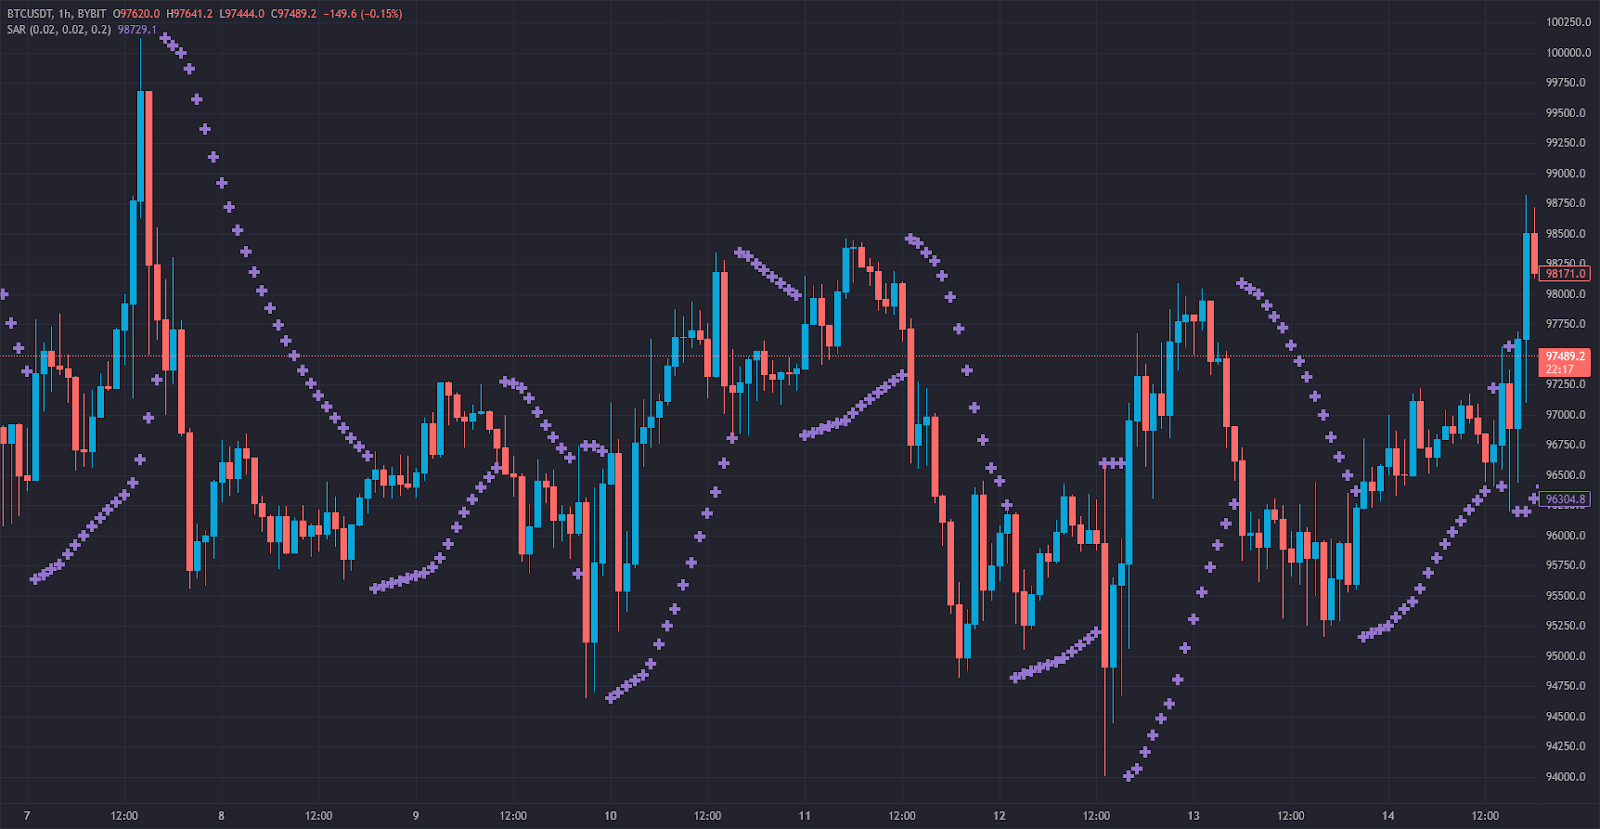
- Parabolic SAR (Stop and Reverse) is a trend-following indicator that helps traders identify potential reversals and trend continuation.
- The indicator appears as a series of dots placed above or below the price on a chart.
- When dots are below the price, it signals an uptrend; when dots are above the price, it signals a downtrend.
- The acceleration factor (AF) adjusts the sensitivity of the indicator to price movements.
- Parabolic SAR is ideal for trend-trading strategies, while moving averages provide a smoother but slower trend-following approach.
In this article, we’ll explore what the Parabolic SAR is, how it’s calculated, and how it compares to moving averages, another popular trend-following tool.
How Is the Parabolic SAR Used in Trading?
The Parabolic SAR indicator, developed by J. Welles Wilder Jr., is designed to identify trend direction and reversals. It helps traders determine optimal entry and exit points in trending markets.
Key Components of the Parabolic SAR:
- Dots Above the Price – Indicates a downtrend and signals potential selling opportunities.
- Dots Below the Price – Suggests an uptrend and indicates possible buying opportunities.
- Acceleration Factor (AF) – A dynamic value that increases as the trend continues, making the indicator more responsive to price movements.
- Parabolic Curve – The gradual movement of dots that tracks price action, helping traders confirm trend strength.
Trading Signals from the Parabolic SAR:
- Trend Confirmation: If the dots remain consistently above or below the price, it confirms the existing trend.
- Reversal Signals: When the dots switch from above to below the price (or vice versa), it signals a potential reversal.
- Stop-Loss Placement: Traders use the dots as a dynamic stop-loss level to lock in profits.
- Trend Acceleration: As the trend progresses, the dots move closer to price action, signaling increasing momentum.
The Parabolic SAR is best suited for trending markets and may generate false signals in choppy, sideways conditions.
How the Parabolic SAR Works + Formula
Curious about the math behind Parabolic SAR? You can calculate it using the following formula:
Uptrend Calculation:

Downtrend Calculation:

Where:
- SAR = Current Parabolic SAR value
- SARprevious = Last Parabolic SAR value
- AF (Acceleration Factor) = Starts at 0.02 and increases by 0.02 with each new high or low in the trend (max value = 0.20)
- EP (Extreme Point) = The highest high (in an uptrend) or lowest low (in a downtrend)
The Parabolic SAR moves closer to the price as the trend continues, increasing the probability of identifying reversals early. Tealstreet automatically calculates the Parabolic SAR, making it easy for traders to interpret the indicator.
Parabolic SAR Trading Strategies
1. Trend-Following Strategy
Traders use the Parabolic SAR to confirm an ongoing trend. If dots remain below the price, they stay in a long position. If dots are above, they hold a short position until a reversal is signaled.
2. Reversal Strategy
A change in dot placement signals a potential reversal. Traders look for confirmation from other indicators, such as RSI or MACD, before entering a new position.
3. Stop-Loss Trailing Strategy
Traders use the Parabolic SAR dots as a dynamic stop-loss level, locking in profits while allowing trends to develop.
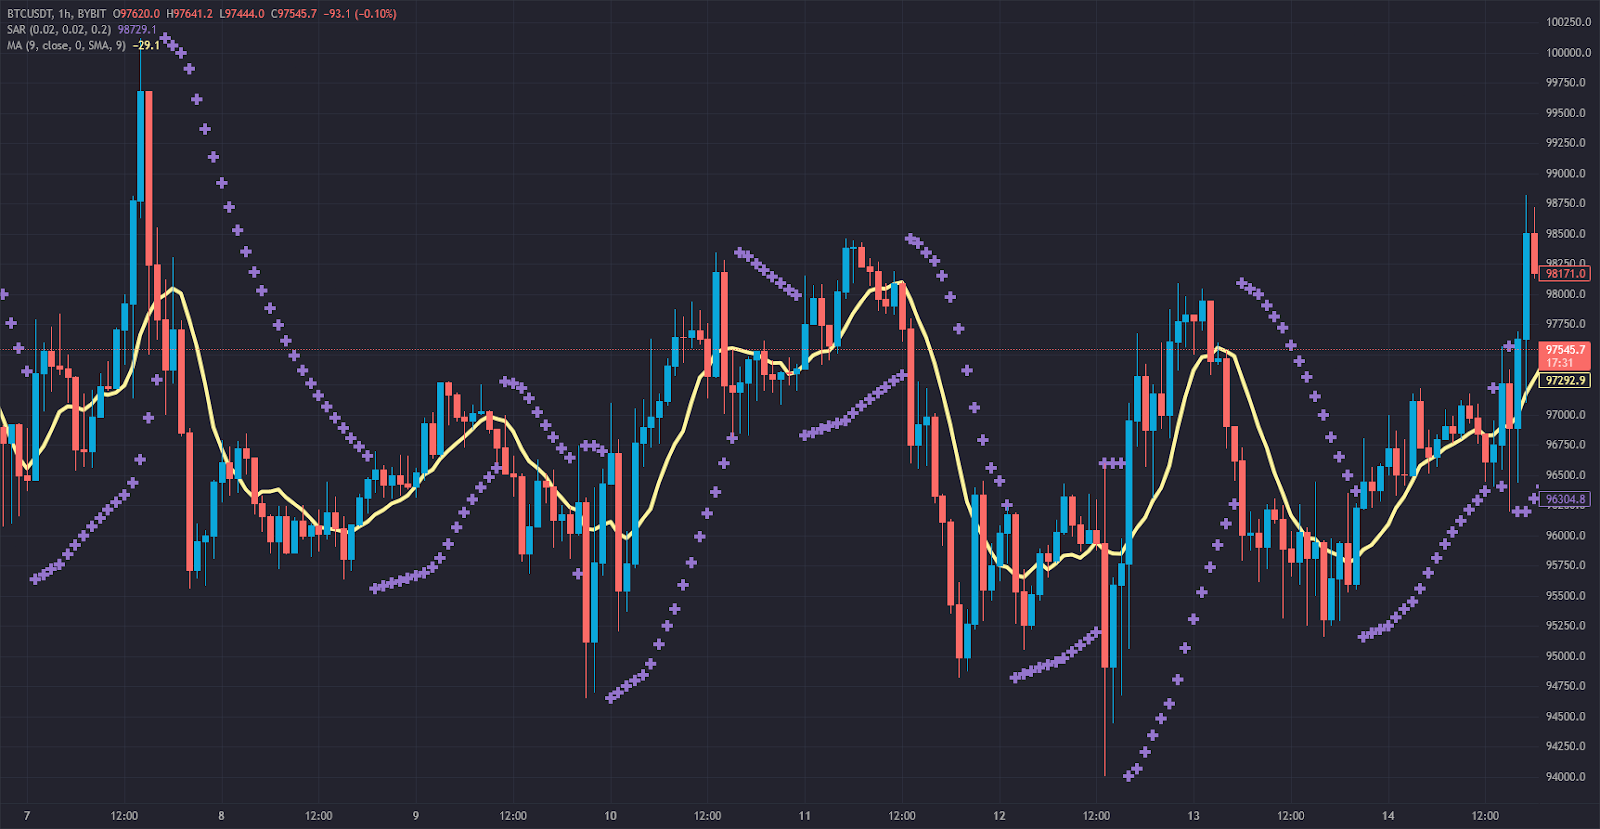
4. Combining with Moving Averages
Combining the Parabolic SAR with a moving average can improve trend confirmation. If the price is above the moving average and the Parabolic SAR dots are below the price, it strengthens a bullish bias.
Parabolic SAR vs. Moving Averages
Both the Parabolic SAR and moving averages are trend-following indicators, but they differ in application.
Key Differences:
- Parabolic SAR reacts faster to price changes, making it better for short-term trend identification.
- Moving Averages smooth out price action, reducing noise but lagging behind trend changes.
- Best Use Case: Parabolic SAR is favored for active traders looking for quick trend reversals, while moving averages are preferred for long-term trend-following strategies.
Many traders combine both indicators to strengthen their analysis.
Stay Ahead of the Market
with Tealstreet
🚀 FAQs
1. Why is the Parabolic SAR important for traders?
The Parabolic SAR helps traders identify trend direction and reversals, making it a valuable tool for determining optimal entry and exit points.
2. How do traders interpret the Parabolic SAR for buy or sell signals?
- Dots below the price suggest a buy signal.
- Dots above the price indicate a sell signal.
- A switch in dot placement signals a potential trend reversal.
3. What are the common pitfalls of using the Parabolic SAR?
- False signals in ranging markets can lead to unnecessary trades.
- Over-reliance on SAR without additional confirmation from indicators like RSI or MACD may increase risk.
- Best suited for trending markets, not sideways movements.
4. Is the Parabolic SAR effective in all markets?
Yes, Parabolic SAR works in crypto, forex, stocks, and commodities markets, but it is most effective in strong trending conditions.