
TL;DR Key Takeaways
- RSI, or Relative Strength Index, shows momentum by measuring recent price changes.
- It’s used to determine if an asset is overbought (above 70) or oversold (below 30).
- Most platforms include RSI calculators, so traders don’t need to calculate it manually.
- RSI is ideal for detecting market reversals. MACD, on the other hand, focuses on trend confirmation.
In this article, we’ll explore what RSI is, how it’s calculated, and how it compares to MACD, another popular indicator.
How is RSI used in trading?
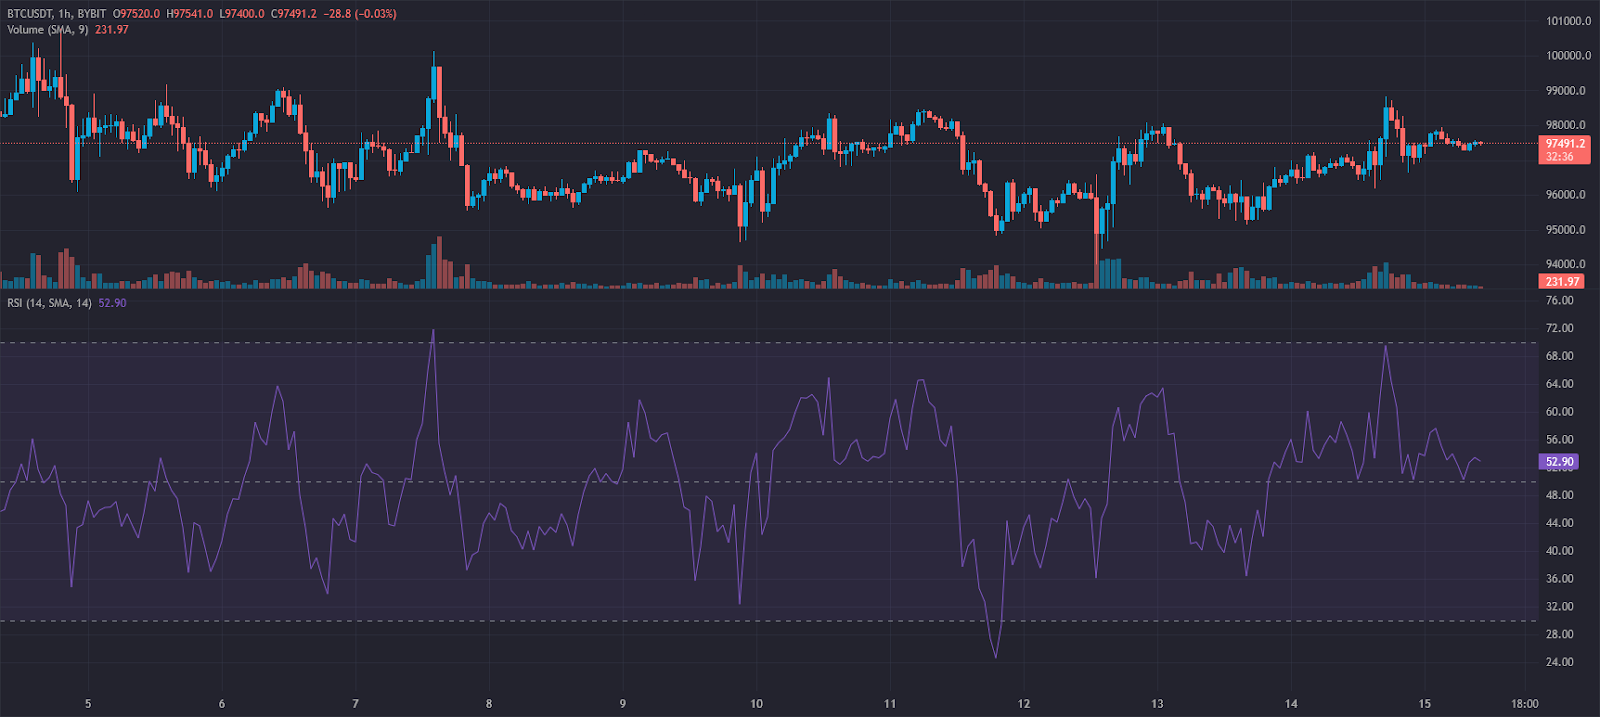
The Relative Strength Index (A.K.A. RSI) is a momentum oscillator that evaluates price movement over a set period (typically 14 days). It measures the speed and magnitude of recent price changes to determine whether an asset is overbought or oversold.
This distinction makes RSI particularly useful for gauging market sentiment in short-term time frames. When the price is:
- Above 70 RSI - It signals bullish sentiment, indicating the asset may be overbought. Many traders consider this a great opportunity for selling.
- Below 30 RSI - It reflects bearish sentiment, suggesting the asset may be oversold. This is seen as a good buying opportunity by many.
To better understand RSI in practice, let’s consider an example of a trader who uses this indicator to refine their strategy. While the RSI helps this trader identify potential trend reversals, it also serves a more confirmatory purpose: helping validate entry and exit points.
Example
Suppose a trader sees that a stock’s RSI drops below 30 while the price stabilizes. This could indicate a reversal is near, leading the trader to prepare for a potential buy signal. Conversely, if an asset's RSI surpasses 70, the trader might anticipate a pullback or correction and consider exiting the position.
Additionally, traders sometimes use RSI divergence as a signal. If the price forms a new high while RSI forms a lower high, it might indicate a potential bearish reversal. Conversely, if the price forms a lower low while RSI forms a higher low, a bullish reversal could be near.
How RSI Works + Formula
Curious about the math behind RSI? Here’s a quick breakdown of the Relative Strength Index formula:
To calculate the RSI value, follow these steps:
- Calculate the Average Gain and Average Loss over the past 14 periods.
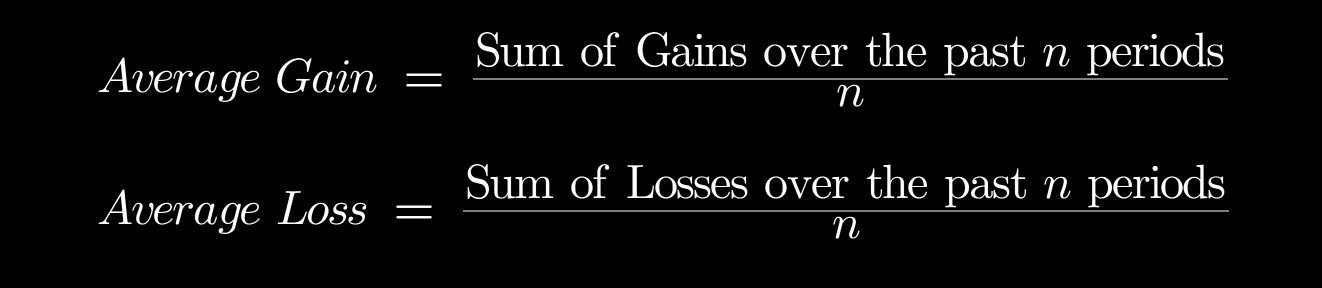
- Determine the Relative Strength (RS): Divide Average Gain by Average Loss.
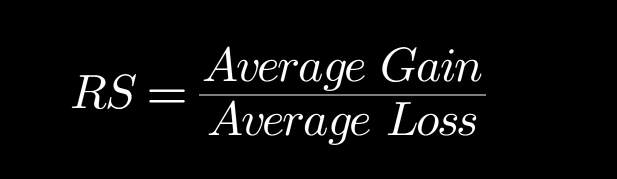
- Apply the RSI formula: Take 100 and subtract the result of 100 divided by (1 plus the Relative Strength, RS).

This way, the RSI formula provides a clear picture of an asset’s momentum.
Tealstreet automatically calculates RSI, displaying it as a line graph below the price chart and is easily accesible via its Indicators dropdown. This makes it easy for traders to interpret overbought and oversold signals at a glance.
Best RSI Trading Strategies
1. RSI Overbought & Oversold Strategy
Traders use the 70 and 30 levels to identify potential reversals. A price above 70 may signal an upcoming pullback, while a price below 30 may indicate a buying opportunity.
2. RSI Divergence Strategy
When RSI and price action move in opposite directions, it can signal a possible trend reversal. A bullish divergence happens when RSI forms higher lows while price forms lower lows. A bearish divergence occurs when RSI forms lower highs while price forms higher highs.
3. RSI & Moving Averages Strategy
Pairing RSI with moving averages (such as the 50-day or 200-day MA) helps traders filter out false signals. RSI signals are often more reliable when they align with a strong moving average trend.
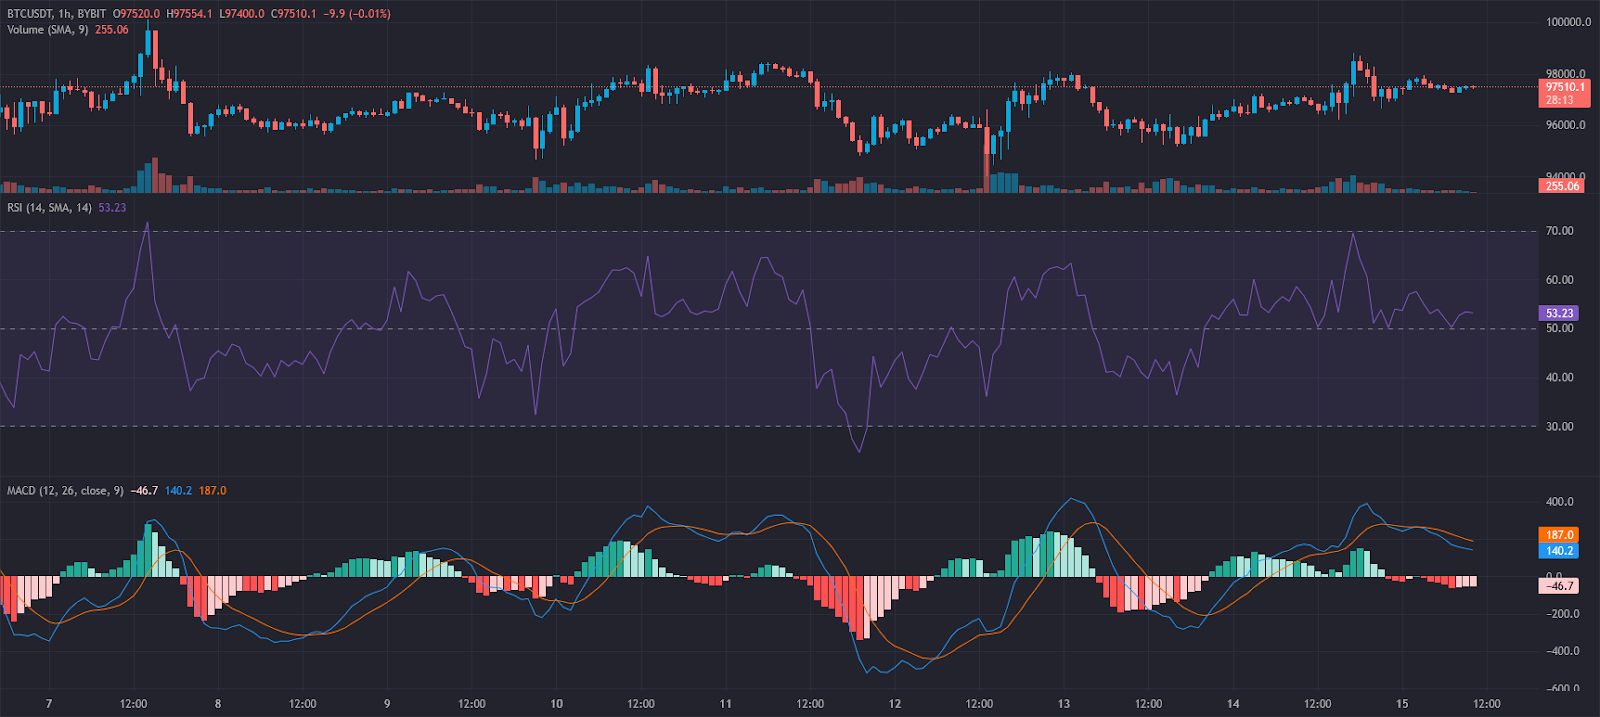
RSI vs. MACD
Many traders find it challenging to distinguish between RSI and MACD since both are momentum indicators. However, they serve different purposes:
- RSI measures the speed and magnitude of price movements to determine overbought or oversold conditions.
- MACD (Moving Average Convergence Divergence) focuses on trend-following and trend strength using moving averages.
Key Differences
- RSI trading strategies are ideal for detecting reversals in price movements.
- MACD, on the other hand, is better for confirming existing trends and identifying crossovers.
Since both tools serve different purposes, there is no definitive "better" option. The choice depends entirely on the trader’s goals: anticipating reversals (RSI) or confirming trends (MACD). That said, these indicators often complement each other, providing a more comprehensive analysis when used together.
Stay Ahead of the Market
with Tealstreet
🚀 FAQs
1. Why is RSI important for day traders?
RSI is crucial for day traders because it helps identify overbought and oversold conditions, allowing traders to anticipate potential reversals. This makes it a valuable tool for short-term trading strategies.
2. How do traders interpret RSI to identify buy or sell signals?
Traders interpret RSI by watching for levels above 70 (sell signals) and below 30 (buy signals). Some also look for RSI divergences, where the RSI and price action move in opposite directions, signaling potential trend shifts.
3. What are the common pitfalls of relying solely on RSI for trades?
One common pitfall is using RSI in isolation. RSI can remain overbought or oversold for extended periods in strong trends, leading to premature entries or exits. Combining RSI with other indicators like MACD or moving averages can improve accuracy.
4. Are there specific markets or asset types where RSI is more effective?
RSI is particularly effective in volatile markets like crypto and stocks, where price swings create frequent overbought and oversold conditions. It may be less effective in low-volatility markets where price movements are more gradual.