
TL;DR Key Takeaways
TL;DR
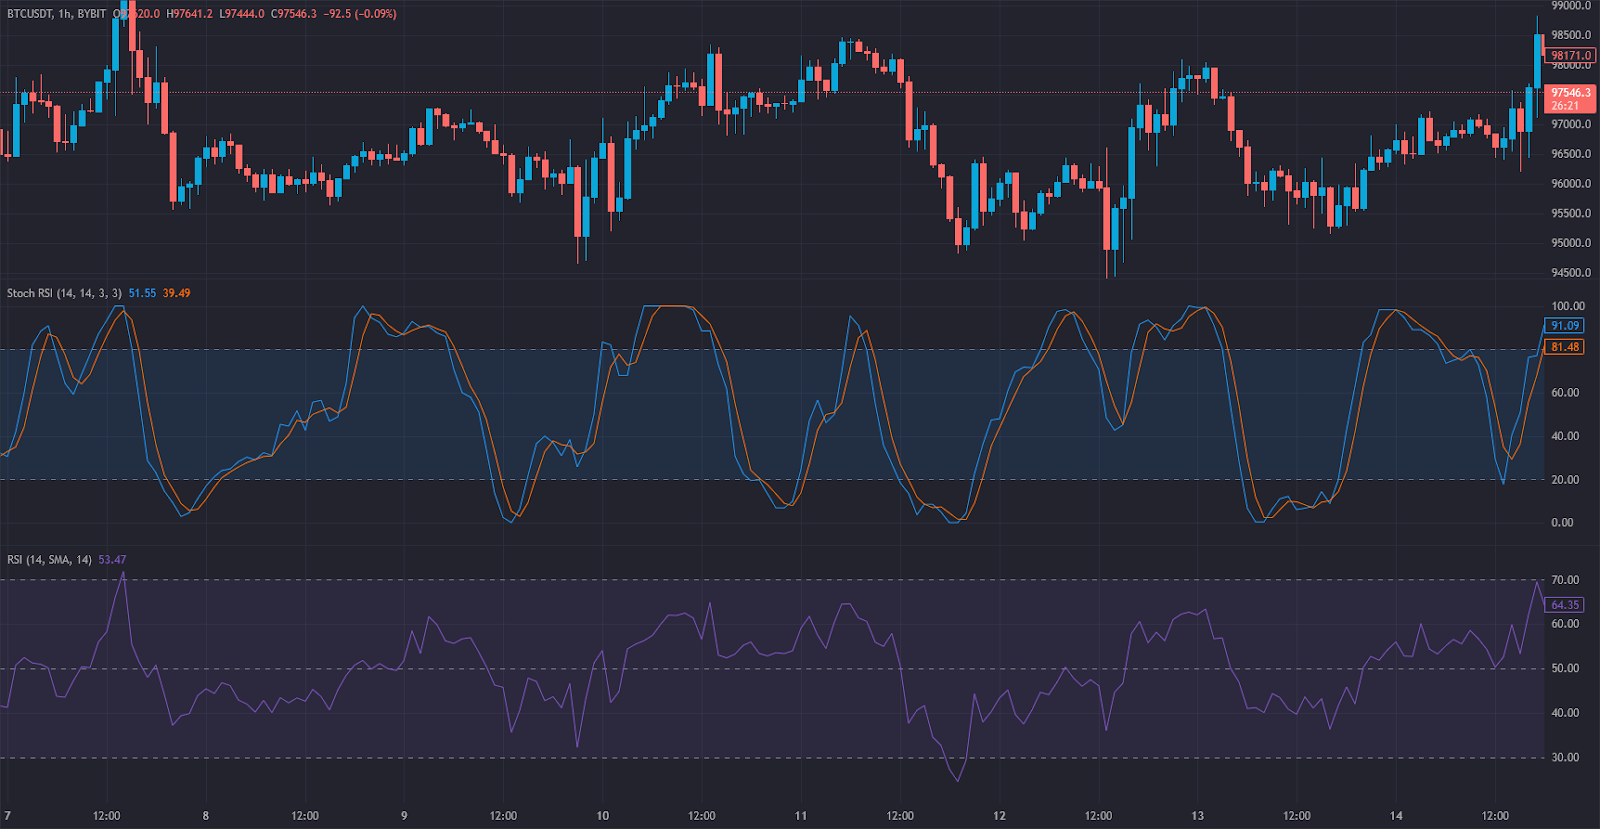
- Stochastic RSI (Stoch RSI) is a momentum oscillator that measures the relative strength index (RSI) against its own high-low range over a specified period.
- It helps traders identify overbought and oversold conditions with increased sensitivity compared to standard RSI.
- The indicator ranges from 0 to 100 (or 0 to 1, depending on platform settings), with key levels at 80 (overbought) and 20 (oversold).
- Most trading platforms calculate Stochastic RSI automatically, making it easy to use.
- Stochastic RSI is ideal for short-term momentum strategies, while regular RSI provides a broader trend overview.
In this article, we’ll explore what Stochastic RSI is, how it’s calculated, and how it compares to RSI, another widely used momentum indicator.
How Is the Stochastic RSI Used in Trading?
The Stochastic RSI indicator enhances the traditional RSI by applying the stochastic formula to RSI values rather than price. This results in a more sensitive momentum oscillator that can generate faster trading signals.
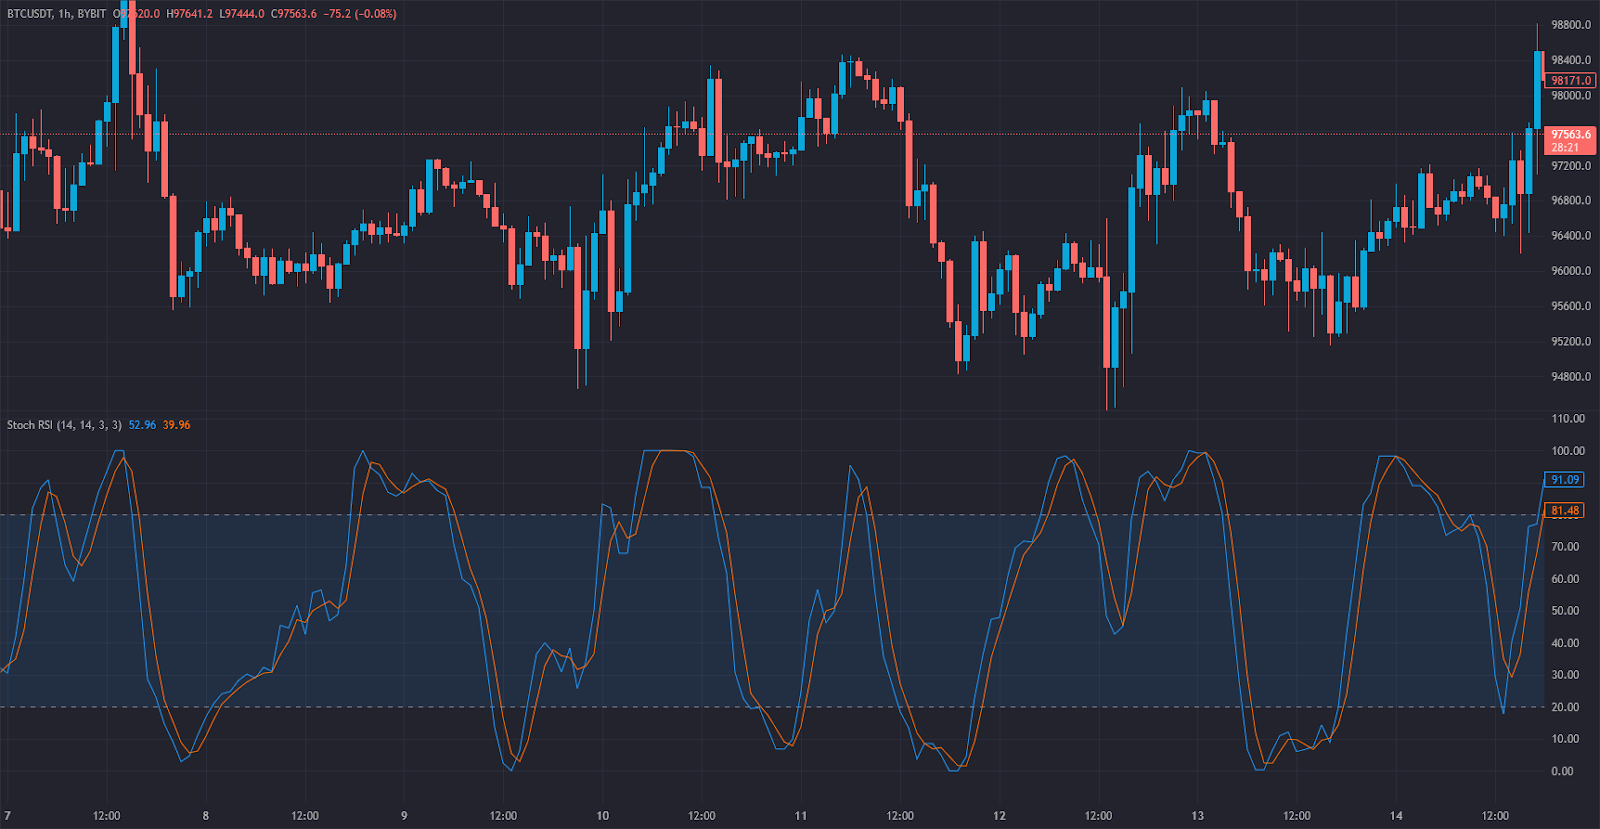
Key Components of the Stochastic RSI:
- %K Line – The main Stochastic RSI line, calculated based on RSI values over a set period (typically 14).
- %D Line – A smoothed moving average of the %K line, often a 3-period SMA.
- Overbought Level (80) – Indicates that RSI is near its recent highs, suggesting possible downside pressure.
- Oversold Level (20) – Shows that RSI is near its recent lows, hinting at potential upward movement.
Trading Signals from the Stochastic RSI:
- Crossing Above 20: A potential bullish signal, indicating oversold conditions.
- Crossing Below 80: A potential bearish signal, suggesting overbought conditions.
- %K Crosses Above %D: A bullish crossover, signaling a possible buying opportunity.
- %K Crosses Below %D: A bearish crossover, hinting at a potential sell signal.
- Divergences: If price and Stochastic RSI trends diverge, it could indicate an upcoming reversal.
Stochastic RSI is particularly useful for traders looking for fast momentum shifts in crypto, forex, stocks, and commodities markets.
How the Stochastic RSI Works + Formula
Curious about the math behind Stochastic RSI? Follow these steps:
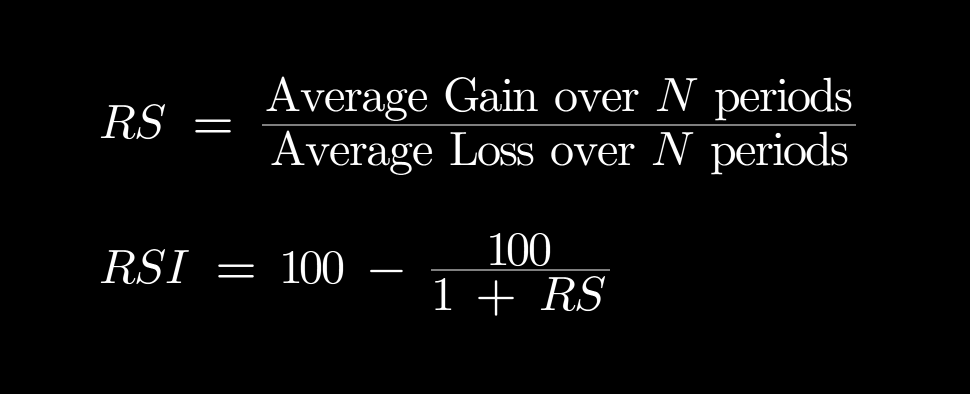
- Calculate the Relative Strength Index (RSI) values in the lookback period you want to analyze with the Stochastic Formula:
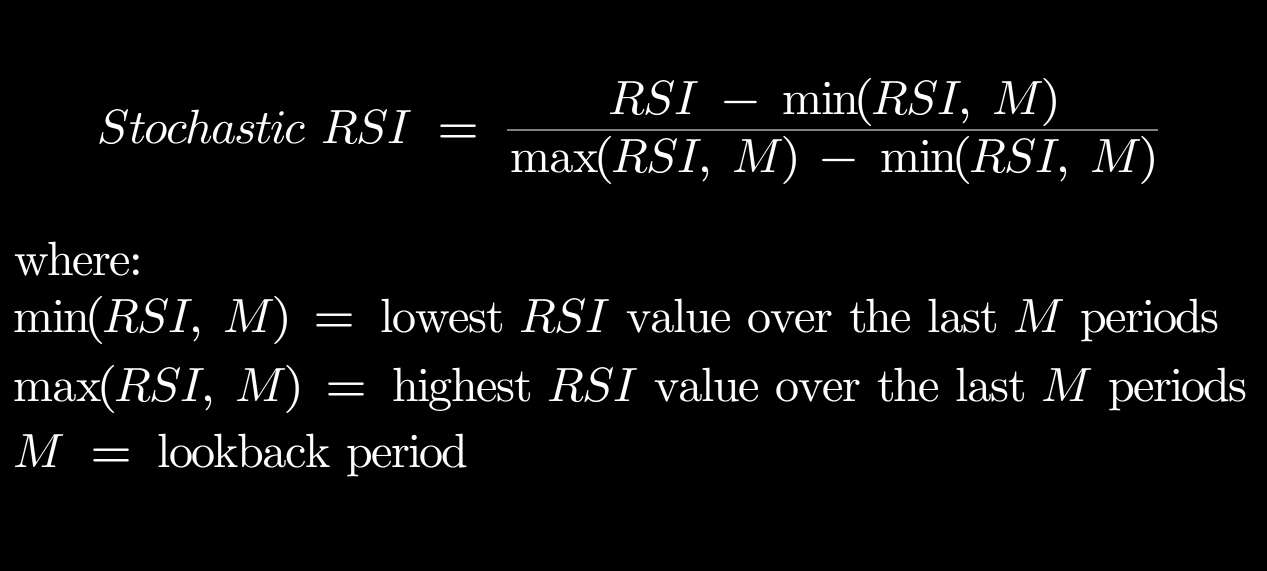
- Apply the Stochastic Formula to RSI Values where:
- Lowest RSI = Lowest RSI value in the lookback period (e.g., 14 days)
- Highest RSI = Highest RSI value in the same period
- Calculate the %D Line:
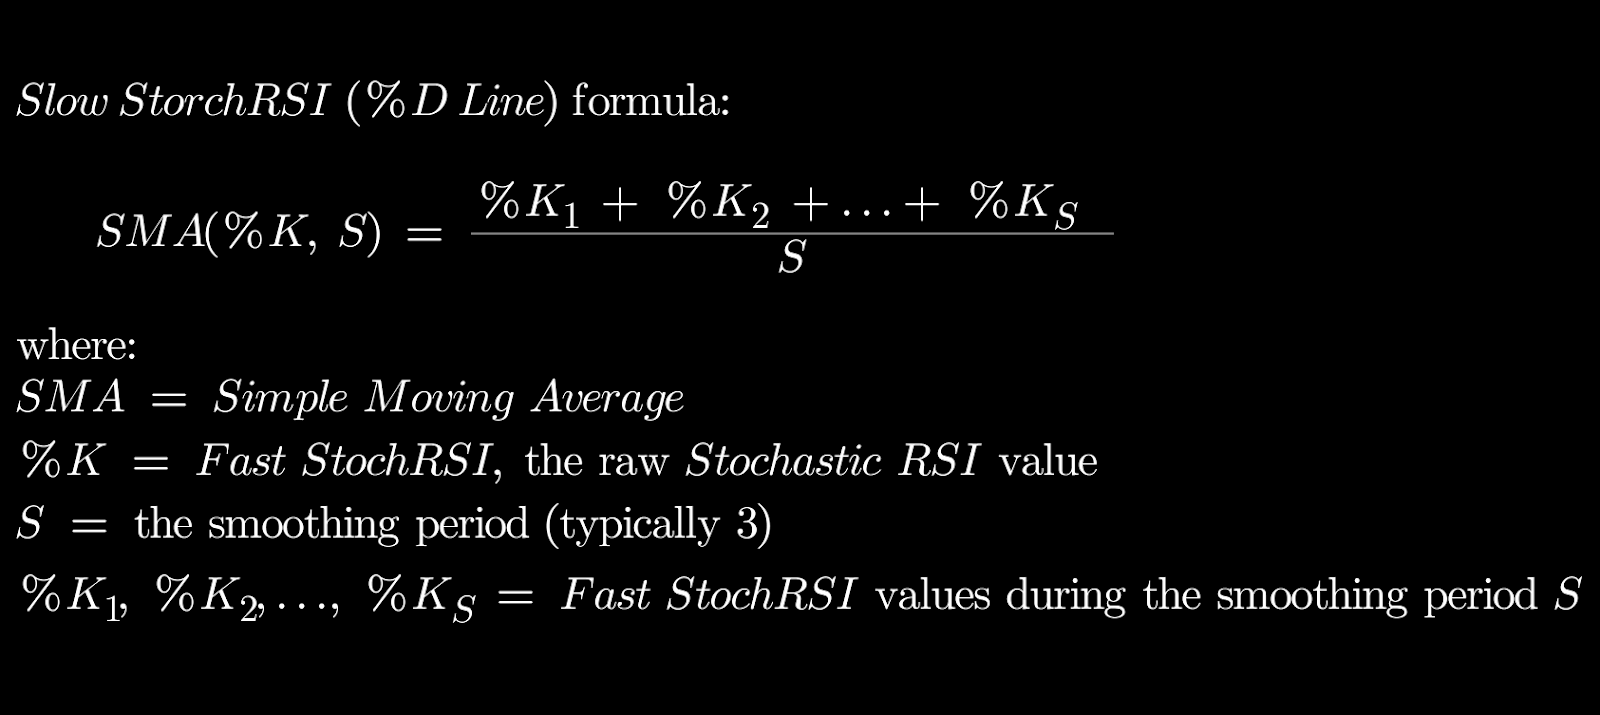
The good news is that you don’t need to make any of these calculations to leverage Stochastic RSI. Tealstreet automatically plots it, it’s easily accesible via its Indicators dropdown.
Stochastic RSI Trading Strategies
1. Overbought/Oversold Strategy
Traders look for potential reversals when the Stochastic RSI crosses key levels. A cross above 20 suggests a bullish opportunity, while a cross below 80 indicates bearish pressure.
2. Crossovers Strategy
Watching the interaction between the %K and %D lines can help confirm trend reversals. When the %K line crosses above the %D line, it generates a buy signal, whereas a downward cross suggests selling.
3. Trend Confirmation Strategy
Stochastic RSI can be used alongside trend-following indicators like Moving Averages or Bollinger Bands to validate market trends. If the Stochastic RSI is in an overbought zone but moving averages suggest an uptrend, traders may wait for additional confirmation before entering trades.
4. Divergence Strategy
If the Stochastic RSI moves in the opposite direction of price, it signals potential reversals. For example:
- Bullish divergence occurs when the price makes a new low, but the Stochastic RSI doesn’t confirm it.
Bearish divergence happens when the price reaches a new high, but the Stochastic RSI remains neutral or declines.
Stochastic RSI vs. Regular RSI
Many traders compare Stochastic RSI to regular RSI, as both are momentum indicators. However, there are key differences:
Key Differences:
- Stochastic RSI is a second derivative of price, meaning it reacts faster than regular RSI.
- Regular RSI measures price momentum directly, while Stochastic RSI measures the RSI’s position within its own range.
- Stochastic RSI is better for short-term trading, while regular RSI is more useful for long-term trend analysis.
Best Use Case:
- Stochastic RSI is preferred for momentum-based trading strategies.
- Regular RSI is better suited for trend-following strategies.
Many traders use both indicators together for additional confirmation.
Stay Ahead of the Market
with Tealstreet
🚀 FAQs
1. Why is Stochastic RSI important for traders?
Stochastic RSI provides faster momentum signals compared to standard RSI, helping traders identify overbought and oversold conditions more precisely.
2. How do traders interpret Stochastic RSI for buy or sell signals?
- When Stochastic RSI crosses above 20, it suggests an oversold recovery and potential buy signal.
- When Stochastic RSI crosses below 80, it signals overbought conditions and a potential selling opportunity.
- Crossovers between the %K and %D lines indicate trend reversals.
3. What are the common pitfalls of using Stochastic RSI?
- Increased sensitivity can lead to false signals in choppy markets.
- Best when combined with trend-following indicators like moving averages or Bollinger Bands.
- Not ideal for sideways markets without additional confirmation tools.
4. Is Stochastic RSI effective in all markets?
Yes, Stochastic RSI works in crypto, forex, stocks, and commodities markets, but it is particularly useful in high-volatility environments.