
TL;DR Key Takeaways
TL;DR
- The Volume indicator measures the number of shares, contracts, or tokens traded within a specific time frame.
- It helps traders assess the strength of price movements and potential trend reversals.
- High volume during price increases suggests strong buying interest, while high volume during declines indicates strong selling pressure.
- Most platforms calculate volume automatically, making it easy to interpret.
- Volume is ideal for confirming trends and identifying potential reversals, while On-Balance Volume (OBV) offers a cumulative view of volume flow.
In this article, we’ll explore what the Volume indicator is, how it’s used, and how it compares to other volume-based indicators like OBV and the Volume Weighted Average Price (VWAP).
How Is the Volume Indicator Used in Trading?
The Volume indicator is one of the most fundamental tools in trading. It tracks the total trading activity for an asset over a given period, providing insights into market sentiment, liquidity, and trend strength.
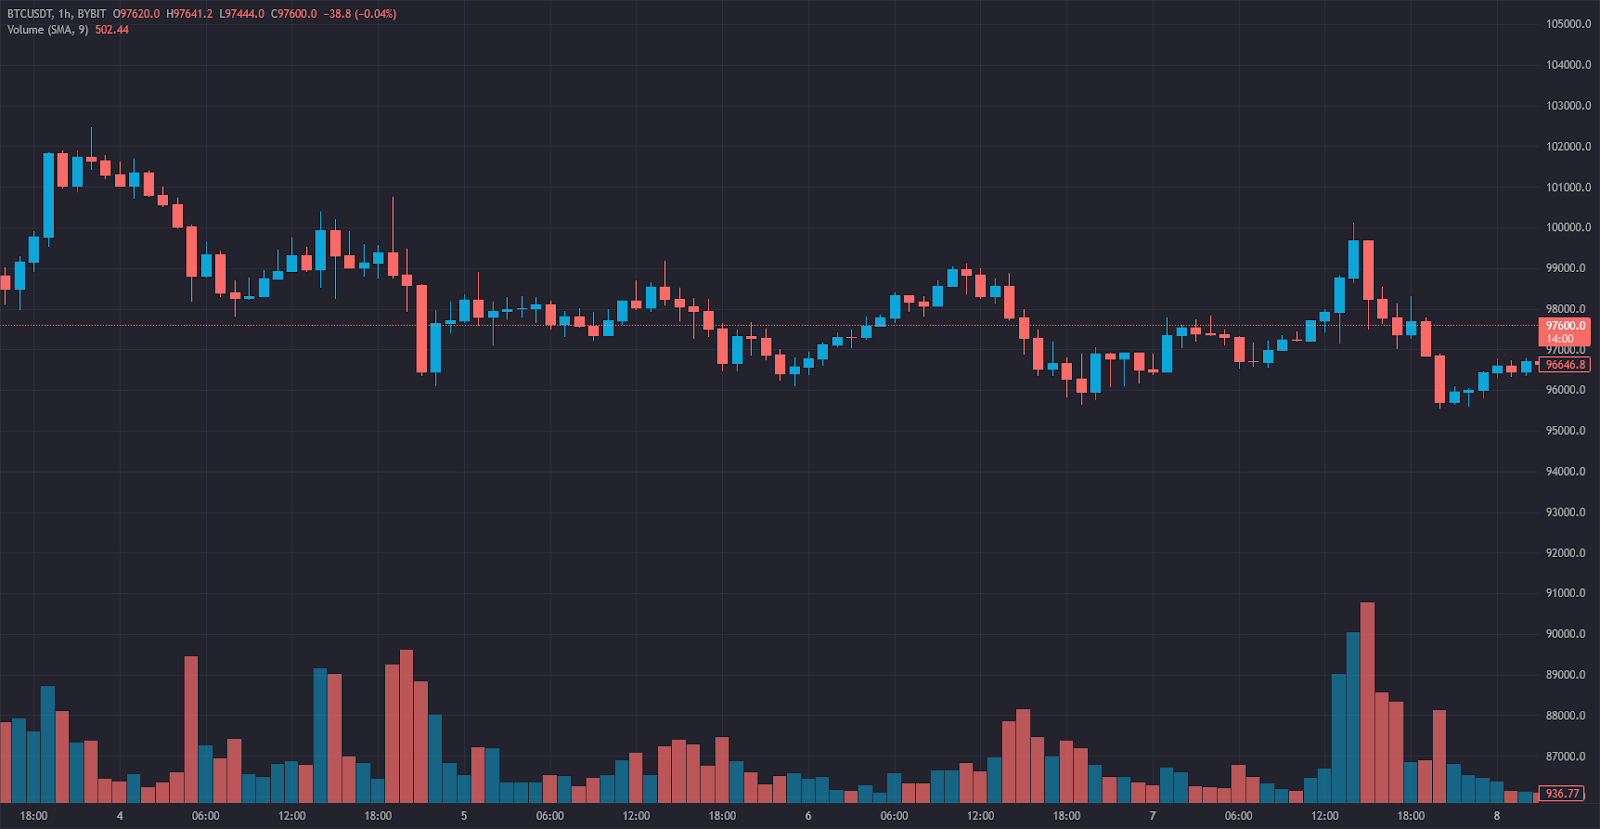
Key Components of the Volume Indicator:
- Volume Bars: Represent trading volume per time frame, often color-coded (green for buying volume, red for selling volume).
- Average Volume Line: A moving average of volume to identify abnormal spikes.
- Volume Spikes: Sudden increases in volume that may signal breakouts, trend continuations, or reversals.
Trading Signals from the Volume Indicator:
- Rising Volume with Price Increase: Confirms a strong uptrend.
- Rising Volume with Price Decrease: Suggests heavy selling pressure and potential bearish continuation.
- Low Volume in a Trend: Signals weakening momentum, often preceding a reversal or consolidation.
- Volume Spikes at Key Levels: May indicate breakouts or failed moves, depending on price action.
Volume is particularly useful in crypto, forex, stocks, and commodities markets, helping traders gauge participation and market strength.
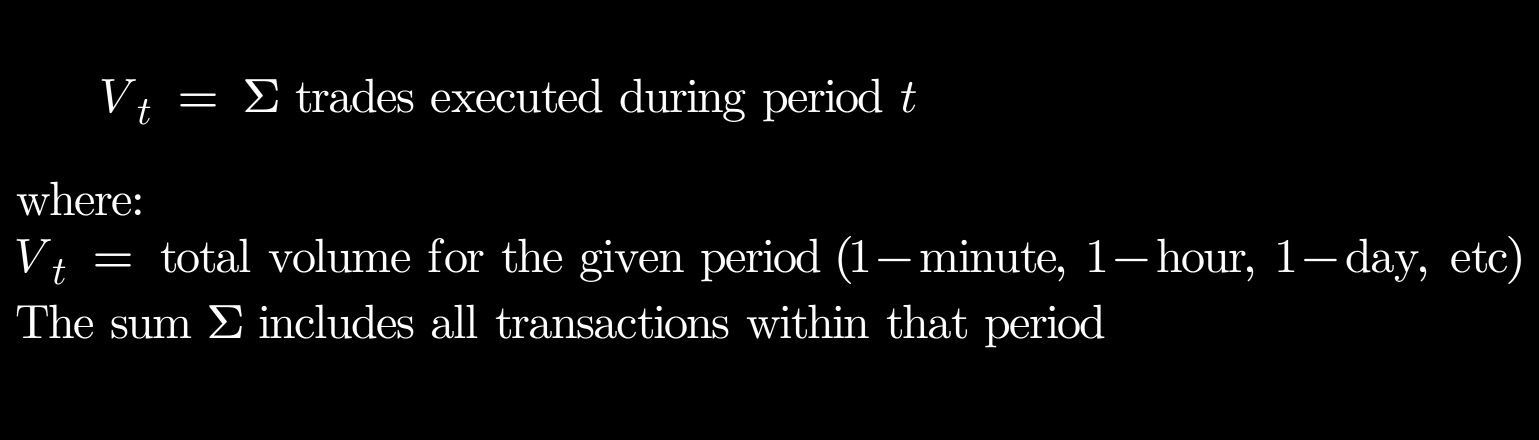
How the Volume Indicator Works + Formula
The Volume indicator doesn’t have a complex formula since it simply tracks the number of transactions for an asset within a selected timeframe. However, traders analyze volume in combination with price action to interpret market behavior effectively.
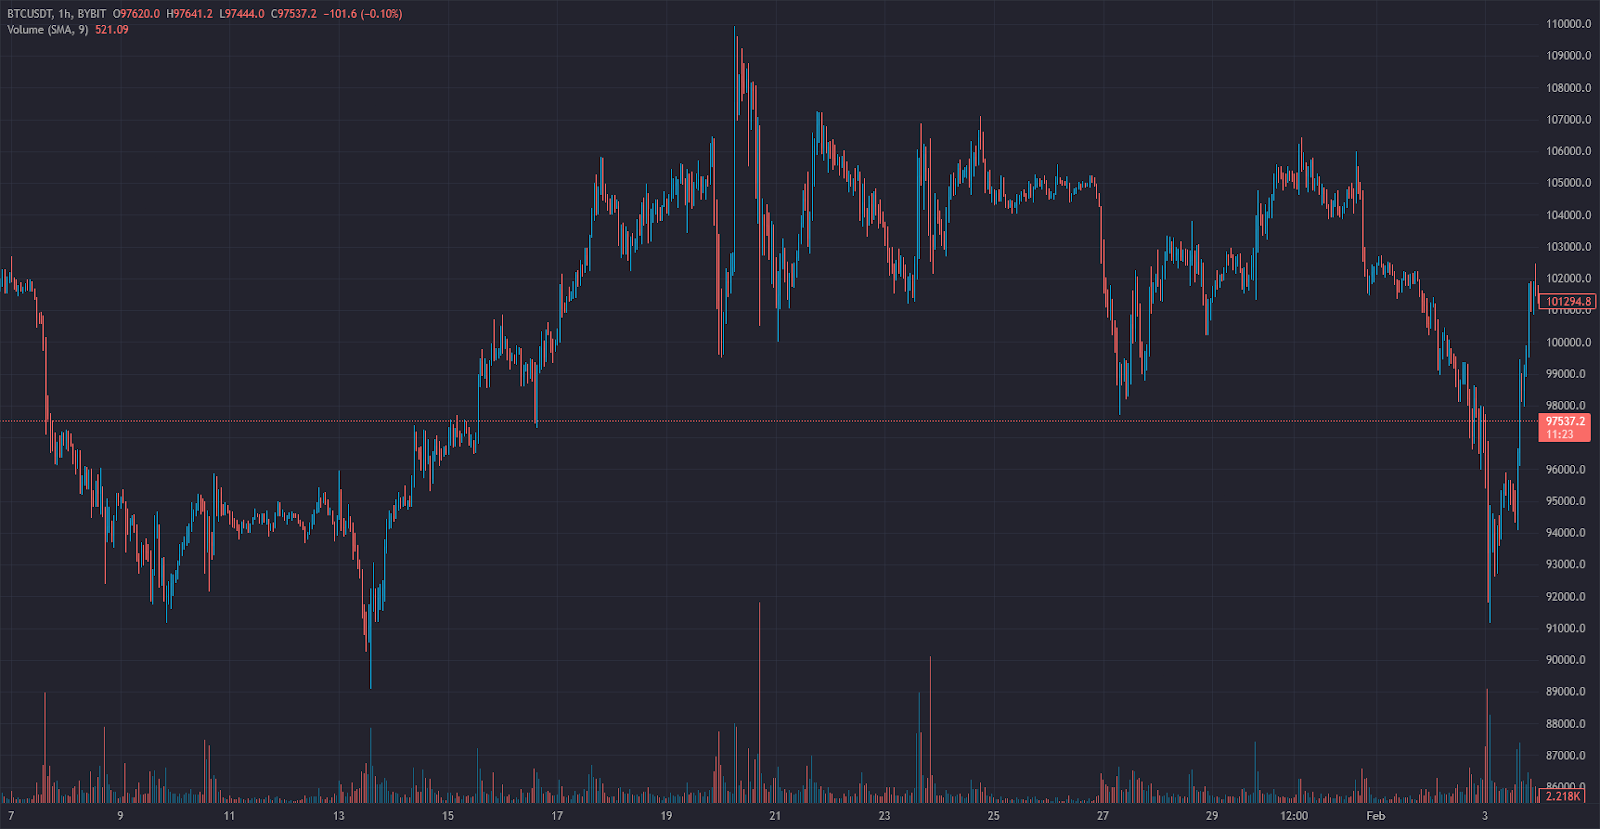
How to Read Volume Data:
- Compare current volume to historical averages to detect unusual activity.
- Look for volume divergence—if price moves up but volume declines, it suggests weak momentum.
- Use moving averages on volume to smooth out noise and highlight significant trends.
Most charting platforms display volume automatically as histogram bars below the price chart.
Volume Indicator Trading Strategies
1. Volume Breakout Strategy
Breakouts with high volume confirm strong participation and increase the likelihood of a sustained move. Traders look for volume surges as price moves above key resistance levels.
2. Volume Confirmation Strategy
Traders use volume to confirm trend strength. If price rises while volume increases, the uptrend is likely to continue. If price rises but volume declines, it suggests a weakening trend.
3. Volume Reversal Strategy
Divergences between price and volume can signal potential reversals. If price reaches new highs but volume declines, it suggests weakening bullish momentum and a possible downturn.
4. Volume Exhaustion Strategy
After a strong price move, a sudden volume spike followed by reduced activity can indicate exhaustion, signaling an upcoming reversal or consolidation.
Volume Indicator vs. On-Balance Volume (OBV) vs. VWAP
Traders often compare the Volume Indicator with On-Balance Volume (OBV) and Volume Weighted Average Price (VWAP) to gain additional insights.
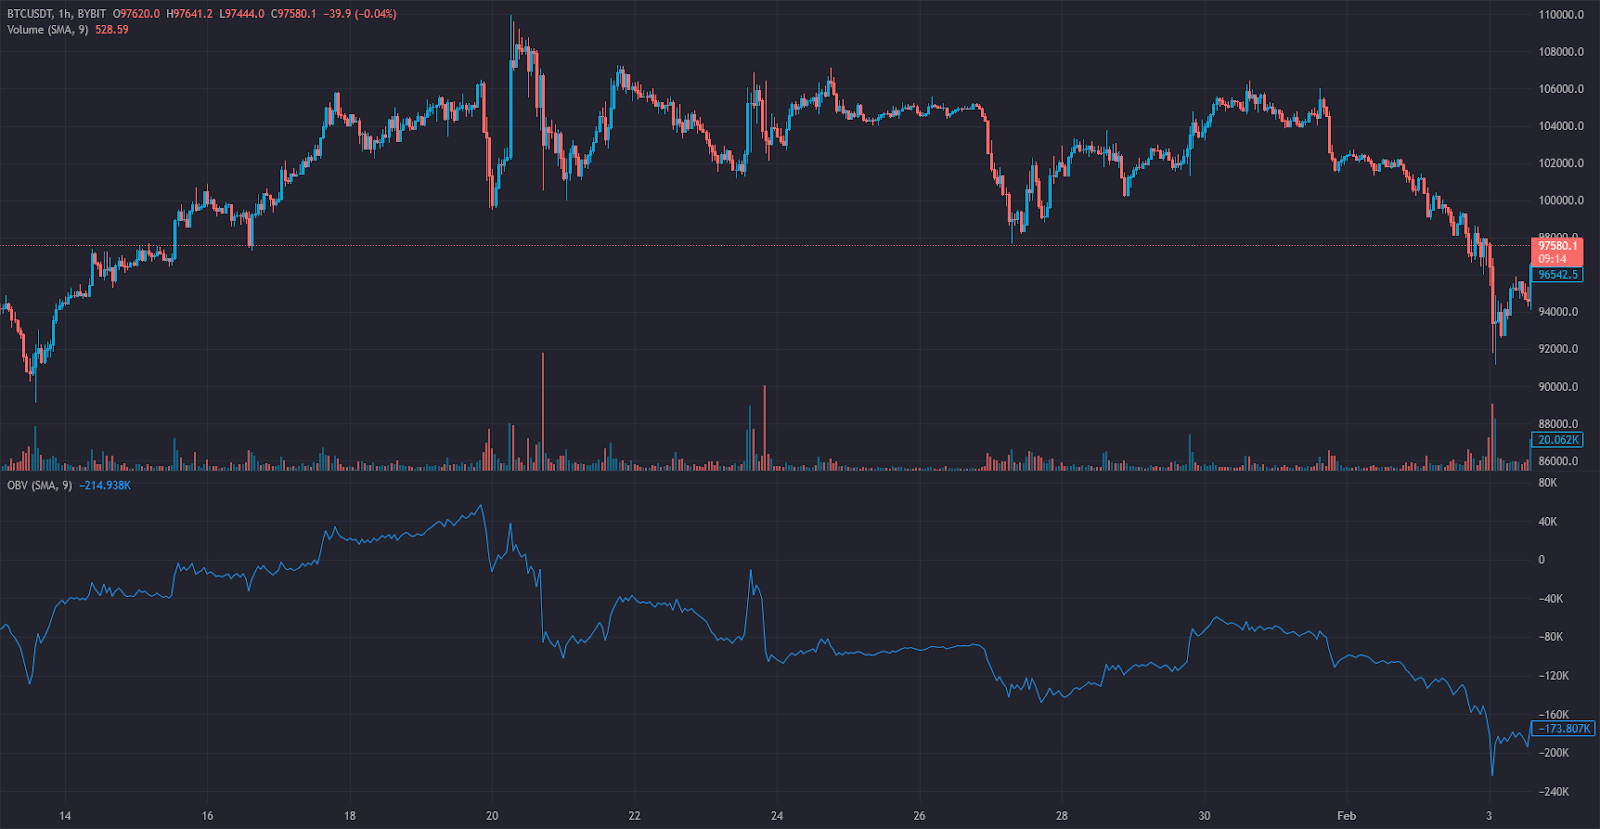
Key Differences:
- Volume Indicator: Measures raw trading volume without bias.
- On-Balance Volume (OBV): A cumulative volume-based indicator that tracks buying and selling pressure.
- VWAP (Volume Weighted Average Price): A price benchmark that accounts for both price and volume over time.
Best Use Case:
- Volume Indicator: Best for analyzing market participation and confirming trends.
- OBV: Useful for detecting institutional accumulation/distribution.
- VWAP: Preferred by institutional traders for fair value execution.
Many traders use a combination of these indicators to strengthen their analysis.
Stay Ahead of the Market
with Tealstreet
🚀 FAQs
1. Why is the Volume indicator important for traders?
The Volume indicator helps traders assess the strength of price movements, confirm trends, and spot potential reversals.
2. How do traders interpret volume spikes?
- A volume spike with price movement signals increased participation and potential breakout.
- A volume spike without significant price movement may indicate distribution or accumulation.
3. What are common pitfalls when using the Volume indicator?
- Over-reliance on volume without considering price action can lead to misleading signals.
- Low volume periods can produce false breakouts.
- Volume works best when combined with trend indicators.
4. Is the Volume indicator effective in all markets?
Yes, the Volume indicator works well in crypto, forex, stocks, and commodities, particularly in markets with high liquidity.