
TL;DR Key Takeaways
TL;DR
- Volume Profile is a technical indicator that plots trading volume over price levels instead of time.
- It helps traders identify key support and resistance zones based on high trading activity.
- The indicator highlights important levels such as the Point of Control (POC), Value Area (VA), and High/Low Volume Nodes.
- Most trading platforms calculate Volume Profile automatically, making it easy to use.
- Volume Profile is ideal for identifying accumulation/distribution areas, while VWAP (Volume Weighted Average Price) focuses on intraday fair value.
In this article, we’ll explore what Volume Profile is, how it’s calculated, and how it compares to VWAP, another essential volume-based indicator.
How Is the Volume Profile Used in Trading?
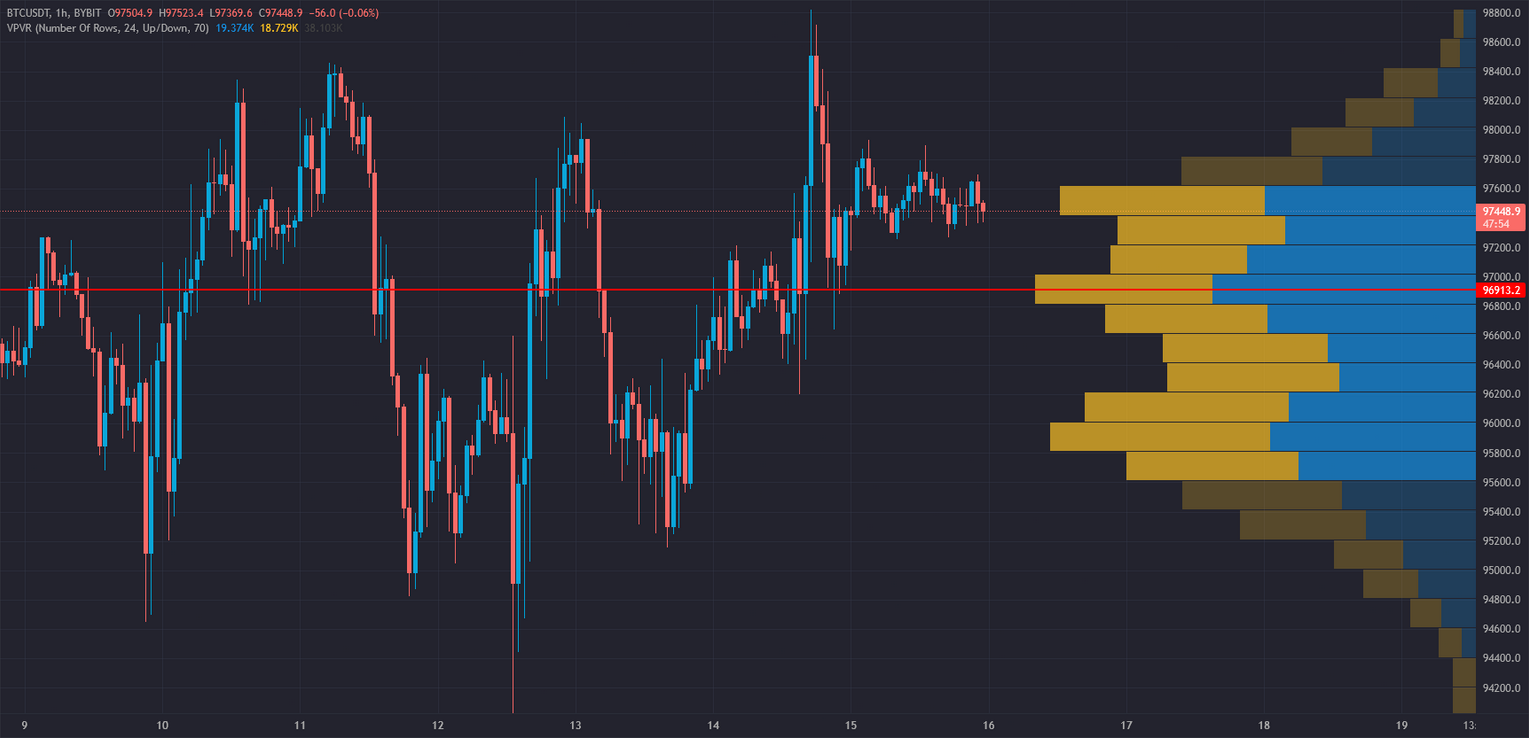
The Volume Profile indicator is a powerful tool for analyzing market structure and price acceptance levels. Unlike traditional volume indicators that measure volume per time period, Volume Profile organizes volume data based on price levels, providing insights into where major market participants are active.
Key Components of the Volume Profile:
- Point of Control (POC) – The price level with the highest traded volume.
- Value Area (VA) – The range where 70% of the volume was traded, consisting of:
- Value Area High (VAH): The upper boundary of the value area.
- Value Area Low (VAL): The lower boundary of the value area.
- High Volume Nodes (HVN) – Price levels with significant trading activity, often acting as strong support/resistance.
- Low Volume Nodes (LVN) – Price levels with low trading activity, where price tends to move quickly through.
Trading Signals from the Volume Profile:
- POC as Support/Resistance: Price reacting to the POC may indicate strong buying or selling interest.
- Breakouts from VA: Price moving above VAH signals bullish strength, while moving below VAL suggests bearish momentum.
- Low Volume Gaps: Areas with low trading volume often act as price magnets, leading to quick movements.
Volume Profile helps traders refine their strategies by identifying where the market perceives fair value and detecting potential breakout points.
How the Volume Profile Works + Formula
Unlike traditional indicators with specific formulas, Volume Profile is computed by analyzing trade volume at different price levels.
To generate a Volume Profile:
- Define a session range (daily, weekly, or custom timeframe).
- Calculate the volume traded at each price level during that session.
- Identify the POC, which is the price level with the highest volume.
- Determine the Value Area, covering 70% of the total traded volume.
- Plot the profile as a histogram on the price chart, showing high and low volume areas.
Tealstreet automatically calculates and plots Volume Profile, and it’s easily available via its Indicators dropdown.
Volume Profile vs. VWAP
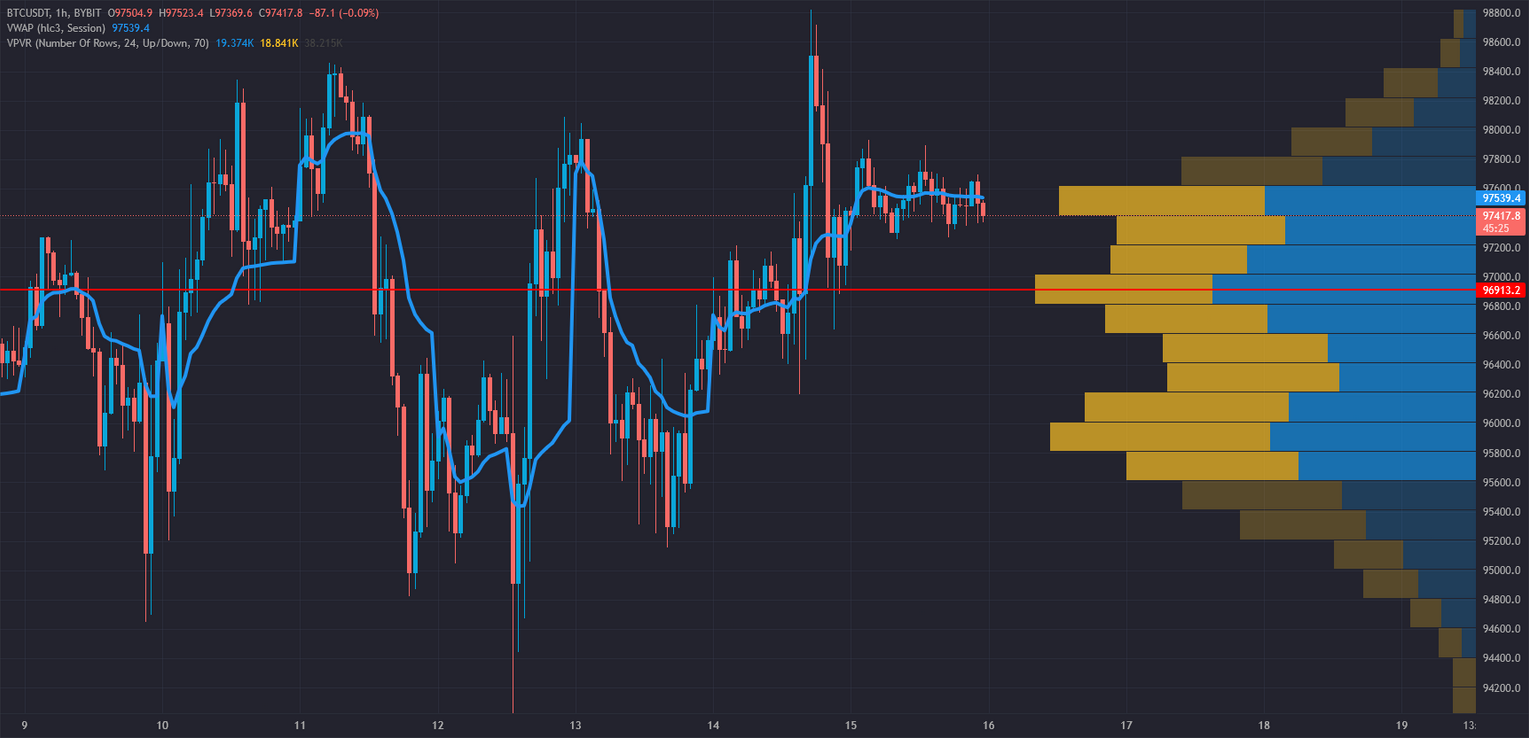
Many traders compare Volume Profile to VWAP (Volume Weighted Average Price) since both are volume-based indicators, but they serve different purposes.
Key Differences:
- Volume Profile maps volume distribution across price levels, while VWAP tracks the average price weighted by volume over time.
- Volume Profile is ideal for identifying long-term support/resistance levels, while VWAP is better for intraday price benchmarks.
- Best Use Case: Volume Profile is favored for market structure analysis, while VWAP is preferred for day trading and institutional order execution.
Both indicators are valuable, and many traders use them together to enhance decision-making.
Stay Ahead of the Market
with Tealstreet
🚀 FAQs
1. Why is the Volume Profile important for traders?
Volume Profile helps traders identify key support/resistance levels, providing insights into price areas with high and low trading activity.
2. How do traders interpret the Volume Profile to find trade opportunities?
- POC reactions indicate strong institutional interest.
- Breakouts from the Value Area suggest potential trend continuations or reversals.
- Low Volume Nodes act as price accelerators due to lower liquidity.
3. What are the common pitfalls of using Volume Profile?
- Misinterpreting POC levels as definitive support/resistance without additional confirmation.
- Ignoring low-volume areas that may cause rapid price swings.
- Over-reliance on past volume data without considering real-time market shifts.
4. Is the Volume Profile effective for all markets?
Yes, Volume Profile works well in crypto, forex, stocks, and futures. It is particularly effective in markets with high liquidity and institutional participation.