
TL;DR Key Takeaways
TL;DR
- The Doji candlestick pattern signals market indecision, often appearing before potential reversals or trend continuations.
- To maximize accuracy, traders should confirm the Doji with follow-up candles, trading volume, and complementary indicators like RSI or moving averages.
Market uncertainty can create challenges for traders, leading to unpredictable price action. That’s where the Doji candlestick pattern comes into play: it represents a balance between buyers and sellers, indicating hesitation in the market. In this article, we’ll explore how the Doji works, its variations, and how you can incorporate it into your trading strategy. Let’s dive in.
How Does the Doji Candlestick Pattern Work in Trading?
If you’ve ever asked “How can I identify a Doji candlestick on a chart?” or “What does a Doji mean in trading?”, the answer isn’t complicated. The Doji is a single-candle pattern that forms when the opening and closing prices are nearly equal, resulting in a very small or nonexistent body. It typically appears after an uptrend or downtrend, signaling possible indecision in the market.
A Doji occurs when neither buyers nor sellers gain control, leading to a temporary standoff. Depending on where it forms, the Doji can hint at a trend reversal or continuation, making it a useful tool in technical analysis.
Appearance of a Doji Candlestick Pattern
A Doji candlestick is characterized by:
- A very small or nonexistent body (where the open and close prices are nearly identical)
- Long, short, or no shadows (wicks) on either side
- A resemblance to a cross, plus sign, or inverted T
Unlike other candlestick patterns, the Doji focuses on market indecision rather than a decisive move in one direction. However, different types of Doji formations exist, each with unique implications.
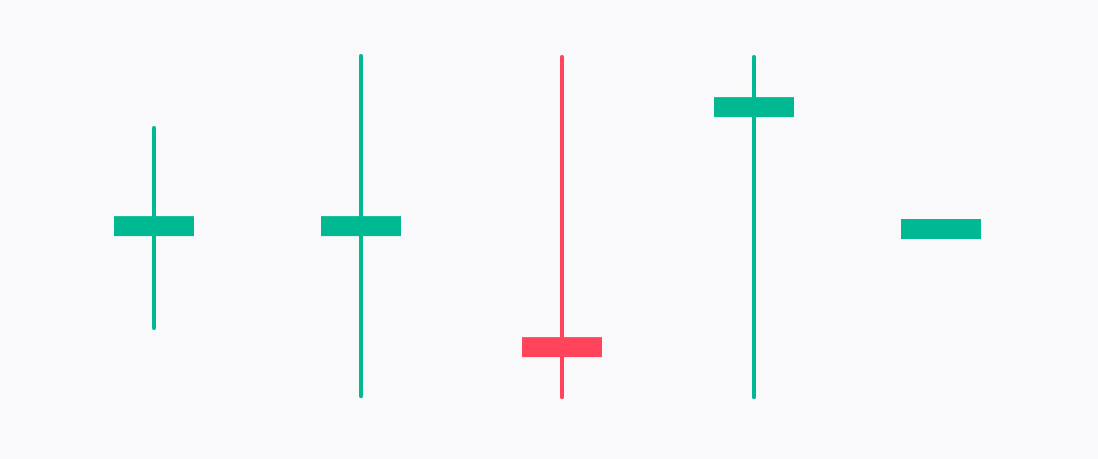
Variations of the Doji Candlestick Pattern
- Standard Doji – The most basic type, where the opening and closing prices are nearly the same, forming a small cross-like shape.
- Long-Legged Doji – Features long upper and lower wicks, indicating significant volatility and market hesitation.
- Gravestone Doji – Forms when the open and close prices are near the low of the session, creating a long upper shadow. This suggests a possible bearish reversal.
- Dragonfly Doji – Forms when the open and close prices are near the high of the session, with a long lower shadow, often signaling a bullish reversal.
- Four-Price Doji – A rare occurrence where the open, high, low, and close prices are identical, showing extreme indecision.
Doji Candlestick Pattern as a Market Signal
The Doji pattern serves as a crucial signal in technical analysis, but its interpretation depends on the market context. It can indicate either a reversal or a continuation, requiring additional confirmation to make an informed trade.
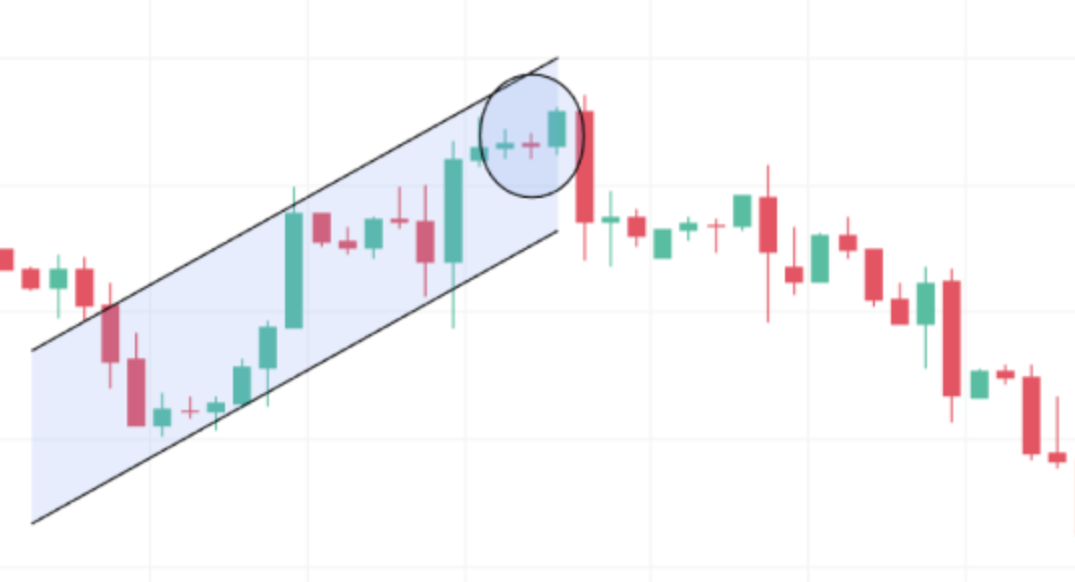
Doji in an Uptrend (Bearish Reversal Signal)
If a Doji appears after a strong uptrend, it suggests that buyers are losing control, and sellers may start taking over. If followed by a bearish confirmation candle, such as a strong red candle, this could indicate a potential trend reversal.
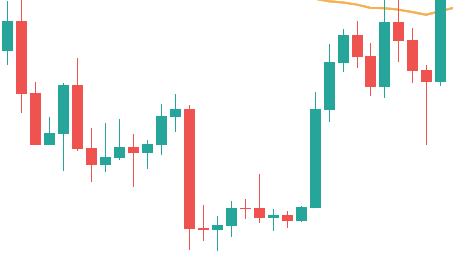
Doji in a Downtrend (Bullish Reversal Signal)
In a downtrend, a Doji may suggest that selling pressure is waning. If a strong bullish candle follows, it could confirm a reversal to the upside.
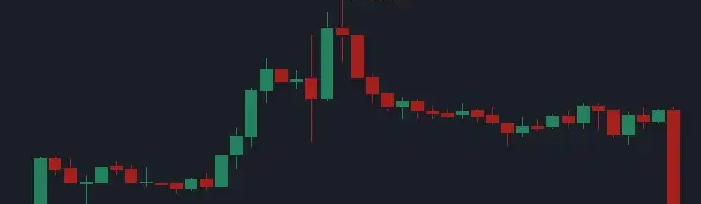
Doji in Consolidation (Trend Continuation)
If a Doji forms within a sideways market or consolidation phase, it may indicate that the trend is pausing before continuing in the same direction. In this scenario, traders should wait for a breakout before acting.
Confirmation: The Key to Doji Candlestick Success
Since the Doji itself does not guarantee a trend reversal or continuation, traders rely on additional confirmation signals:
- Follow-up Candle – A strong bullish or bearish candle after the Doji can validate the potential market direction.
- Volume Analysis – An increase in volume alongside a Doji suggests heightened market interest and a stronger signal.
- Support and Resistance Levels – If a Doji forms near a key support or resistance zone, its significance increases.
- Technical Indicators – Indicators like the Relative Strength Index (RSI) or Moving Averages can help confirm potential trend shifts.
Why Context Matters
No trader should rely on a Doji candlestick pattern in isolation. Context plays a vital role in determining its effectiveness.
- A Doji in a strong trend may simply indicate a brief pause before continuation.
- If a Doji appears at a well-defined support or resistance level, it holds more weight.
- In volatile markets, Doji patterns may be less reliable due to erratic price movements.
By combining the Doji with broader market analysis, traders can improve decision-making and reduce false signals.
Time Frames for Using the Doji Candlestick Pattern
The Doji candlestick pattern can appear across different time frames, from short-term intraday charts to long-term weekly or monthly charts. Here’s how traders apply it:
- Day Traders – Spot Doji patterns on lower time frames (e.g., 5-minute or 15-minute charts) for quick trades.
- Swing Traders – Identify Doji formations on daily or 4-hour charts to anticipate trend reversals.
- Position Traders – Use weekly or monthly Doji patterns to make long-term investment decisions.
Regardless of the time frame, the key principle remains the same: the Doji signals indecision, and traders must wait for confirmation before taking action.
Example: How to Use the Doji Candlestick Pattern in Trading
Imagine an uptrending market where the price reaches a resistance level. Suddenly, a Doji candlestick appears, indicating that buying pressure is fading. To confirm the pattern:
- Wait for the next candle to close below the Doji’s low, signaling a bearish move.
- Check trading volume—if volume spikes, it adds credibility to the reversal.
- Use RSI—if the RSI is overbought, it strengthens the bearish case.
- Enter a short position once confirmation is received, placing a stop-loss above the Doji’s high.
This strategy minimizes risk while capitalizing on potential trend reversals.
Limitations of Trading Based on the Doji Candlestick Pattern
While the Doji is a valuable pattern, it has limitations:
- False Signals – Without confirmation, a Doji can be misleading.
- Market Noise – In highly volatile conditions, Doji patterns may form frequently, reducing reliability.
- Requires Complementary Analysis – Relying solely on the Doji can lead to poor trade decisions.
To mitigate these risks, always combine the Doji with other technical analysis tools.
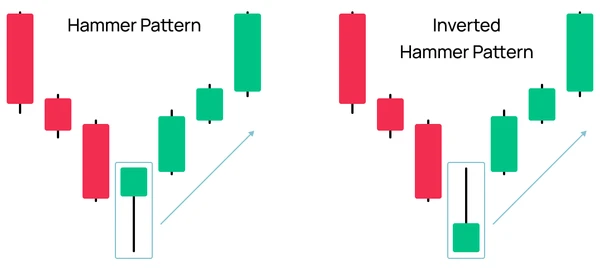
Doji Candlestick Pattern vs. Hammer Candlestick Pattern
While both patterns are used in technical analysis, they have key differences:
- Doji: Indicates indecision and can signal either a reversal or continuation.
- Hammer: Typically appears at the bottom of a downtrend, signaling a potential bullish reversal.
Understanding these differences helps traders apply the right strategy based on market conditions.
What Type of Trading Strategy Suits the Doji Candlestick?
The Doji candlestick pattern is best suited for price action trading, as it focuses on pure market movements. It can be applied in:
- Trend Reversal Strategies – Identifying potential trend changes.
- Breakout Strategies – Confirming price breakouts after consolidation.
- Support and Resistance Trading – Enhancing trading decisions near key price levels.
Stay ahead of the market
with Tealstreet
Final Thoughts
The Doji candlestick pattern is a powerful tool in technical analysis, offering insights into market indecision. However, it should always be used with confirmation signals and additional technical indicators to improve accuracy.
By understanding the different types of Doji, their implications, and proper trading strategies, traders can make more informed decisions and reduce risk.
Ready to enhance your trading? Tealstreet offers fast execution, intuitive controls, and advanced analytics to help you trade where you are.
Doji Candlestick Pattern FAQs
1. How can I identify a Doji candlestick on a chart?
Look for a candlestick with an extremely small body and nearly equal open and close prices. Consider additional factors like wick length and positioning within the trend for better accuracy.
2. Is the Doji candlestick pattern reliable?
It depends on confirmation signals and market context. A Doji near a strong support or resistance level, combined with high trading volume, increases its reliability.
3. Can I use the Doji in all markets?
Yes, the Doji applies to stocks, forex, crypto, and commodities. However, its effectiveness may vary depending on the asset's liquidity and volatility.
4. What is the best time frame for using the Doji?
All time frames work, but higher time frames tend to offer more reliable signals. Shorter time frames may produce more frequent but less reliable Doji formations due to market noise.
