
TL;DR Key Takeaways
- The Engulfing candlestick pattern signals a strong trend reversal when a larger candle completely engulfs the previous one.
- To maximize accuracy, traders should confirm the Engulfing pattern with volume analysis, support and resistance levels, and complementary indicators like RSI or moving averages.
Identifying market reversals is a crucial aspect of trading, as it helps traders enter or exit positions at optimal times. That’s where the Engulfing candlestick pattern comes into play: it is a powerful signal that highlights a shift in market sentiment. In this article, we’ll explore how the Engulfing pattern works, its variations, and how you can incorporate it into your trading strategy. Let’s dive in.
How Does the Engulfing Candlestick Pattern Work in Trading?
If you’ve ever wondered “How can I identify an Engulfing candlestick on a chart?” or “What does an Engulfing pattern mean in trading?”, the answer is relatively straightforward. The Engulfing pattern is a two-candle formation that occurs when a larger candle fully engulfs the previous candle’s body, signaling a potential trend reversal.
This pattern occurs when market sentiment shifts sharply from one direction to the other. Traders use Engulfing patterns to anticipate changes in trend momentum and make informed trading decisions based on market structure and confirmation signals.
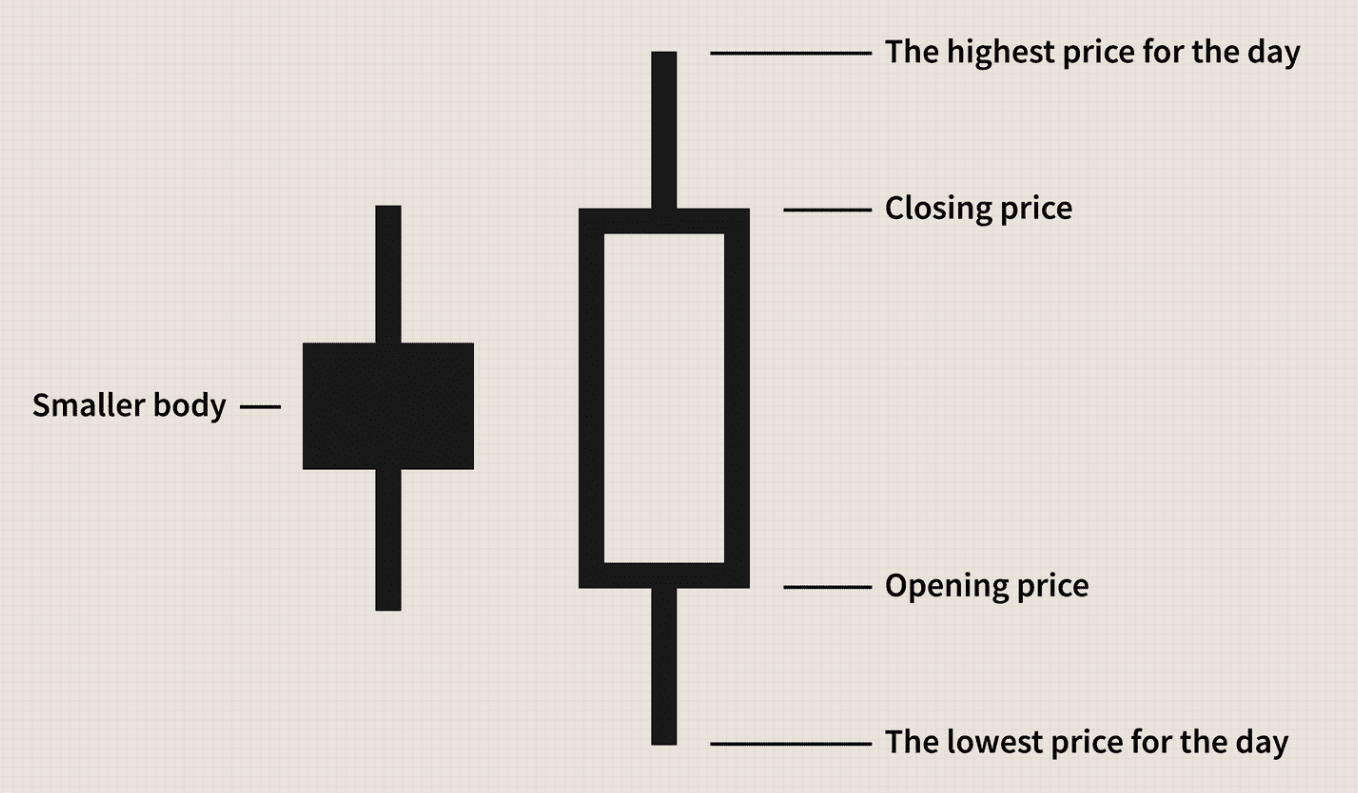
Appearance of an Engulfing Candlestick Pattern
An Engulfing candlestick pattern consists of two candles:
- The first candle is smaller and represents the current trend’s final push.
- The second candle is larger and completely engulfs the first candle’s body, signaling a reversal.
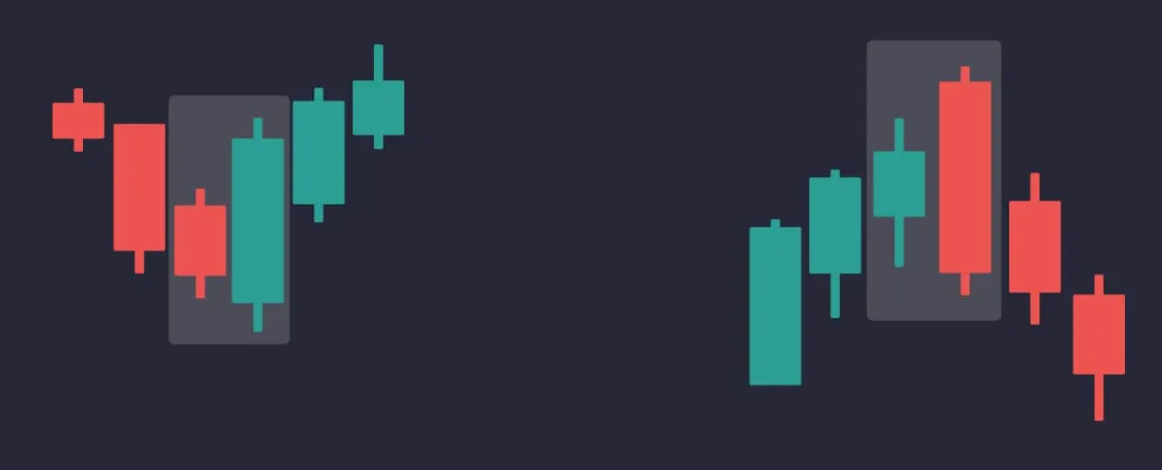
There are two main types of Engulfing patterns:
- Bullish Engulfing Pattern – Appears after a downtrend when a large green candle engulfs the previous red candle, signaling a potential bullish reversal.
- Bearish Engulfing Pattern – Appears after an uptrend when a large red candle engulfs the previous green candle, signaling a potential bearish reversal.
The significance of the Engulfing pattern increases when it forms at key support or resistance levels, aligning with high trading volume.
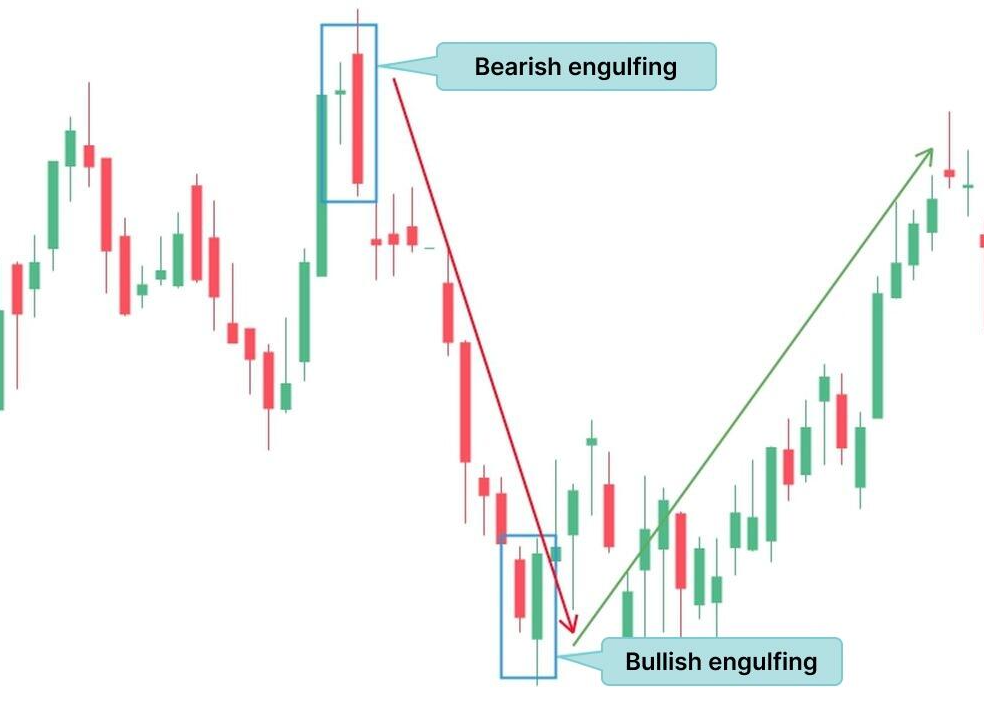
Engulfing Candlestick Pattern as a Market Signal
The Engulfing pattern is a reliable signal for market reversals, but context plays a crucial role in its effectiveness.
Bullish Engulfing Pattern (Bullish Reversal Signal)
A Bullish Engulfing pattern forms after a downtrend, indicating that buyers are gaining control. The larger bullish candle completely engulfs the previous bearish candle, suggesting a shift from selling pressure to buying momentum.
Confirmation criteria:
- The second candle’s close is above the first candle’s open.
- Increased trading volume accompanies the bullish engulfing candle.
- The pattern appears at a key support level.
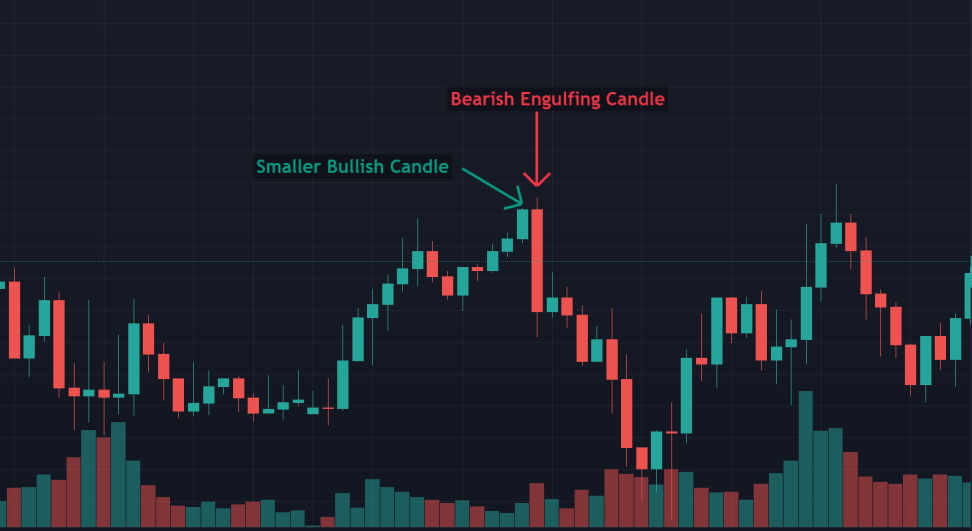
Bearish Engulfing Pattern (Bearish Reversal Signal)
A Bearish Engulfing pattern forms after an uptrend, indicating that sellers are taking control. The larger bearish candle completely engulfs the previous bullish candle, suggesting a shift from buying pressure to selling momentum.
Confirmation criteria:
- The second candle’s close is below the first candle’s open.
- Increased trading volume accompanies the bearish engulfing candle.
- The pattern appears at a key resistance level.
Confirmation: The Key to Engulfing Candlestick Success
Since the Engulfing pattern itself does not guarantee a reversal, traders should seek confirmation through additional indicators:
- Volume Analysis – A spike in volume reinforces the validity of the pattern.
- Support and Resistance Levels – If the Engulfing pattern appears near a major support or resistance level, its reliability increases.
- Momentum Indicators – RSI, MACD, and Stochastic Oscillator can confirm overbought or oversold conditions.
Follow-up Candlestick Patterns – A strong continuation candle after the Engulfing pattern provides further validation.
Why Context Matters
Trading the Engulfing pattern in isolation can lead to false signals. Here’s why context is crucial:
- In strong trends, an Engulfing pattern may signal only a temporary retracement rather than a full reversal.
- The pattern is more reliable when it aligns with trendline support or resistance.
- Combining Engulfing patterns with broader market analysis improves decision-making.
Time Frames for Using the Engulfing Pattern
The Engulfing pattern appears across multiple time frames, making it versatile for different trading styles:
- Day Traders – Identify the pattern on intraday charts (e.g., 15-minute, 1-hour) for short-term opportunities.
- Swing Traders – Look for Engulfing formations on daily charts to capture medium-term trend shifts.
- Position Traders – Spot patterns on weekly or monthly charts to anticipate long-term reversals.
Regardless of the time frame, confirmation is crucial before entering a trade.
Example: How to Use the Engulfing Candlestick Pattern in Trading
Imagine a stock has been in an uptrend and forms a Bearish Engulfing pattern. Here’s how to trade it:
- Identify the Bearish Engulfing pattern near a key resistance level.
- Wait for confirmation through a strong bearish follow-up candle.
- Check trading volume—increased selling volume confirms a shift in sentiment.
- Enter a short position at the close of the confirmation candle.
- Place a stop-loss above the Engulfing pattern’s high to manage risk.
- Use the next support level as a profit target.
This structured approach helps traders manage risk while capitalizing on potential reversals.
Limitations of Trading Based on the Engulfing Candlestick Pattern
Despite its reliability, the Engulfing pattern has limitations:
- False Signals – Not all Engulfing patterns result in a trend reversal.
- Market Noise – In volatile markets, false breakouts may occur.
- Requires Additional Confirmation – Using volume and support/resistance levels is essential.
By combining the Engulfing pattern with other indicators, traders can improve accuracy and minimize risks.
What Type of Trading Strategy Suits the Engulfing Pattern?
The Engulfing candlestick pattern is best suited for price action trading strategies, as it focuses on pure market movement rather than relying on external indicators. It works well in:
- Trend Reversal Strategies – Traders use the Engulfing pattern to catch potential reversals at key support and resistance levels.
- Breakout Strategies – A confirmed Engulfing pattern can signal the beginning of a strong breakout, offering high-probability trade setups.
- Swing Trading – Swing traders look for Engulfing formations on daily or 4-hour charts to anticipate medium-term price movements.
- Scalping Strategies – Short-term traders can leverage Engulfing patterns on lower time frames for quick trades within a trend.
By integrating the Engulfing pattern into these strategies, traders can enhance their market timing and execution precision.
Stay ahead of the market
with Tealstreet
Final Thoughts
The Engulfing candlestick pattern is one of the most powerful reversal indicators in technical analysis. However, its effectiveness depends on proper confirmation and market context. By combining the pattern with volume analysis, support and resistance levels, and complementary indicators, traders can improve their accuracy and reduce false signals. Whether you’re day trading, swing trading, or position trading, the Engulfing pattern can be a valuable tool in your trading arsenal.
Ready to enhance your trading? Tealstreet offers fast execution, intuitive controls, and advanced analytics to help you trade where you are.
Engulfing Candlestick Pattern FAQs
1. How can I identify an Engulfing candlestick on a chart?
Look for a two-candle formation where the second candle fully engulfs the body of the first candle. This pattern can indicate a potential trend reversal.
2. Is the Engulfing candlestick pattern reliable?
The Engulfing pattern is a strong reversal signal, but its reliability increases with confirmation from volume, support and resistance levels, and momentum indicators.
3. Can I use the Engulfing pattern in all markets?
Yes, the Engulfing pattern applies to stocks, forex, crypto, and commodities. However, market conditions and volatility may affect its reliability.
4. What is the best time frame for using the Engulfing pattern?
The Engulfing pattern works across all time frames, but higher time frames (e.g., daily, weekly) generally provide more reliable signals than shorter time frames (e.g., 5-minute, 15-minute charts).
