
TL;DR Key Takeaways
TL;DR
- Fibonacci retracement levels are horizontal lines that indicate potential support and resistance areas where the price could reverse direction.
- To maximize accuracy, traders should confirm Fibonacci retracement levels with other technical indicators, such as moving averages, candlestick patterns, and momentum oscillators.
Fibonacci retracement is a widely used technical analysis tool that helps traders identify potential support and resistance levels in financial markets. By analyzing key ratios derived from the Fibonacci sequence, traders can predict possible reversal points during market corrections, thereby making informed decisions about entry and exit points in their trading strategies.
Understanding the Fibonacci Sequence and Its Application in Trading
The Fibonacci sequence is a series of numbers where each number is the sum of the two preceding ones, starting from 0 and 1. This sequence progresses as 0, 1, 1, 2, 3, 5, 8, 13, and so forth. The significance of this sequence in trading arises from the ratios between these numbers, particularly the "golden ratio" of approximately 1.618. The inverse of this ratio, 0.618 (or 61.8%), along with other derived ratios like 38.2% and 23.6%, are pivotal in identifying potential retracement levels in price movements.
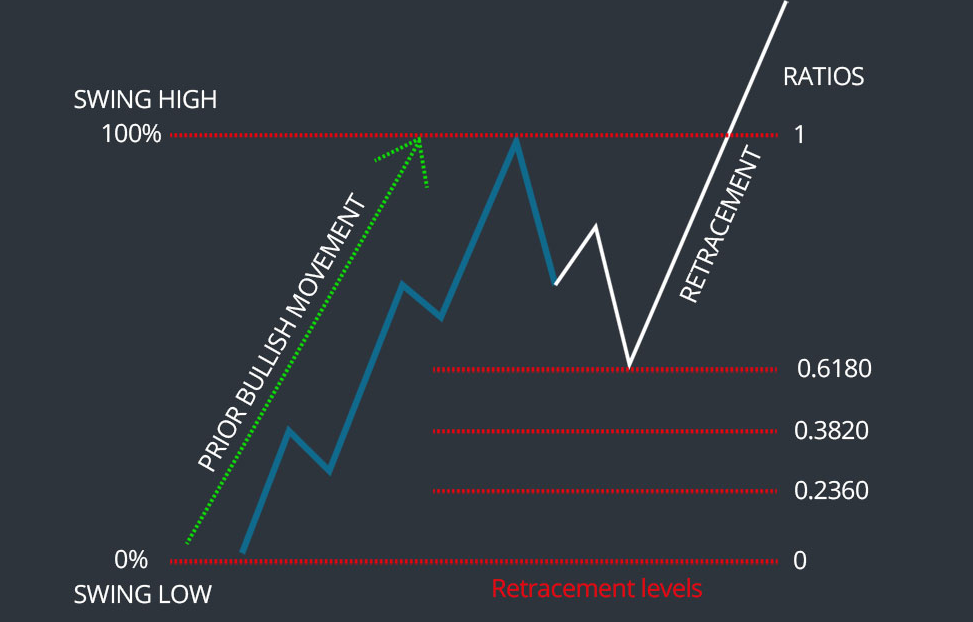
How Does Fibonacci Retracement Work in Trading?
Fibonacci retracement levels are horizontal lines that indicate potential support and resistance areas where the price could reverse direction. These levels are derived from the Fibonacci sequence and are commonly used in technical analysis to predict future price movements.
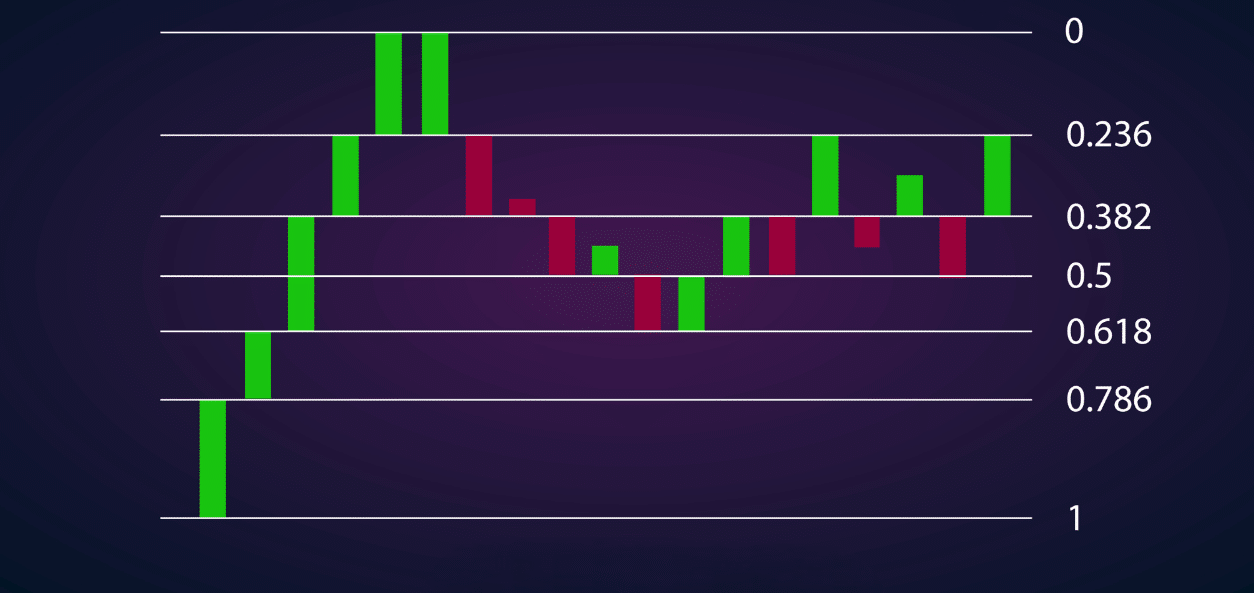
Appearance of Fibonacci Retracement Levels
When plotted on a price chart, Fibonacci retracement levels appear as horizontal lines at key percentage levels: 23.6%, 38.2%, 50%, 61.8%, and 78.6%. These lines are drawn between a significant high and low point, creating a grid that traders use to identify potential reversal zones.
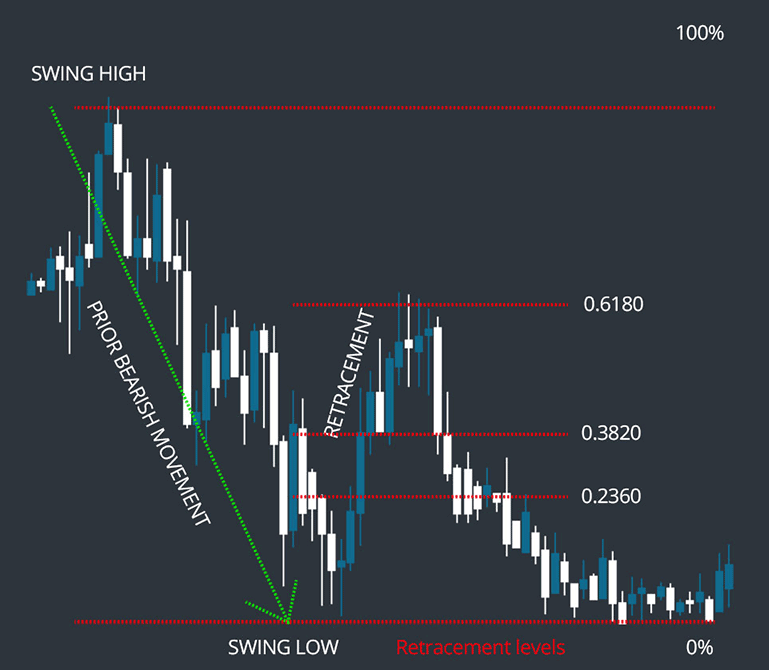
Fibonacci Retracement as a Market Signal
Fibonacci retracement levels are used to identify potential reversal points during market corrections. However, it's important to note that not every retracement will lead to a reversal. Sometimes, the price may continue in the direction of the original trend without significant reversal.
Confirmation: The Key to Fibonacci Retracement Success
Confirmation is crucial when using Fibonacci retracement levels. Traders usually wait for additional signals, such as specific candlestick patterns or confluence with other technical indicators, to validate a potential reversal at a Fibonacci level. Without this follow-up, the retracement level might not hold, leading to false signals.
Why Context Matters
No trader should rely on Fibonacci retracement levels in isolation. Incorporating support and resistance levels, trendlines, or additional indicators like momentum oscillators strengthens the case for making a trade. For example, a Fibonacci retracement level aligning with a long-term support zone and a bullish candlestick pattern provides a stronger signal than the retracement level alone.
Time Frames for Using Fibonacci Retracement
The Fibonacci retracement tool can be applied across all time frames, from one-minute intraday charts to weekly and monthly charts. For example:
- Day traders might use Fibonacci retracement levels on short-term charts to identify potential entry and exit points during the trading day.
- Swing traders could apply the tool on daily or weekly charts to find potential reversal zones over several days or weeks.
Regardless of the time frame, the principle remains the same: identifying potential support and resistance levels where the price may reverse.
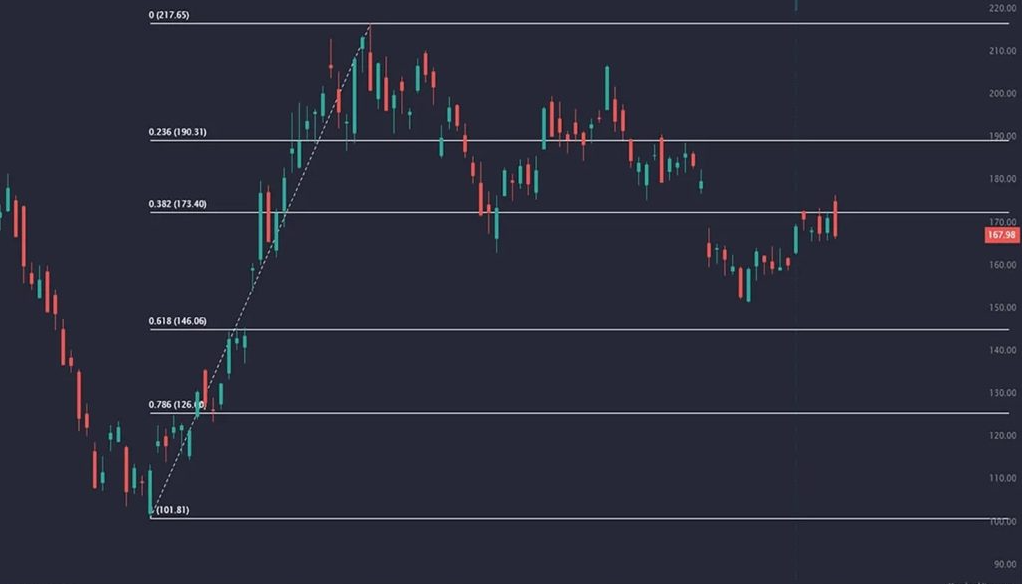
Example: How to Use Fibonacci Retracement in Trading
Imagine a scenario where a stock has risen from $50 to $100. After reaching $100, the price begins to decline. By applying Fibonacci retracement levels, traders can anticipate potential support levels at:
- 23.6% Retracement: $88.20
- 38.2% Retracement: $81.90
- 50% Retracement: $75.00
- 61.8% Retracement: $68.20
- 78.6% Retracement: $57.80
Traders might consider entering a long position if the price shows signs of reversing at the 61.8% retracement level, setting a stop-loss order below the 78.6% level to manage risk.
Limitations of Trading Based on Fibonacci Retracement
While Fibonacci retracement levels are a valuable tool, they are not infallible. False signals can occur, especially in volatile markets. Traders should be cautious when relying solely on these levels without additional confirmation. To mitigate these risks, it's best to combine Fibonacci retracement levels with other technical and fundamental analysis tools.
What Type of Trading Strategy Suits Fibonacci Retracement?
Fibonacci retracement levels are best suited for trend-following strategies. By analyzing price movements and identifying potential reversal points within the trend, traders can spot opportunities to enter or exit positions in real-time. Depending on the market, the strategy can be applied in different ways, such as:
- Forex Trading: Utilizing Fibonacci retracement levels to identify potential support and resistance zones in currency pairs.
- Stock Trading: Applying the tool to determine entry and exit points during market corrections.
- Cryptocurrency Trading: Leveraging Fibonacci levels to navigate the often volatile price movements in digital assets.
Stay ahead of the market
with Tealstreet
Final Thoughts
This article explored how Fibonacci retracement levels work, their significance in market movements, and why confirmation, context, and risk management are essential. You've also learned how to differentiate them from other technical indicators and how to integrate them into your trading approach.
Stay ahead of the market with Tealstreet. Take the Fibonacci retracement strategy for a ride on the fastest crypto trading interface ever.
FAQs
- How can I identify Fibonacci retracement levels on a chart?
To identify Fibonacci retracement levels, select a significant high and low on the price chart. Use a Fibonacci retracement tool to draw lines between these points, which will display the key levels (23.6%, 38.2%, 50%, 61.8%, and 78.6%). - How reliable are Fibonacci retracement levels for predicting market moves?
Fibonacci retracement levels can be effective in identifying potential reversal points, but they are not foolproof. Their reliability increases when used in conjunction with other technical indicators and when there is a confluence of signals. - Can Fibonacci retracement be used in all markets (stocks, forex, crypto)?
Yes, Fibonacci retracement levels are applicable across various financial markets, including stocks, forex, and cryptocurrencies. The underlying principles remain consistent, but it's essential to consider the unique characteristics of each market. - What are the ideal conditions or confirmations to validate a Fibonacci retracement level?
Ideal confirmations include the presence of reversal candlestick patterns at the retracement level, confluence with other technical indicators (such as moving averages or trendlines), and increased trading volume supporting the reversal. - What timeframes work best for using Fibonacci retracement?
Fibonacci retracement levels can be applied to various timeframes, from short-term intraday charts to long-term weekly or monthly charts. The choice of timeframe depends on your trading style and objectives. Generally, higher timeframes provide more reliable signals, while lower timeframes offer more opportunities for active traders.
