
TL;DR Key Takeaways
TL;DR
- The Head and Shoulders pattern signals a potential trend reversal, forming after an uptrend or downtrend.
- To maximize accuracy, traders should confirm the pattern with volume analysis, neckline breakouts, and complementary indicators like RSI or moving averages.
Spotting market reversals early is crucial for traders aiming to maximize profits. The Head and Shoulders pattern is one of the most reliable trend reversal patterns, indicating shifts in buying and selling pressure. In this article, we’ll explore how the Head and Shoulders pattern works, its variations, and how traders can effectively incorporate it into their strategy. Let’s dive in.
How Does the Head and Shoulders Pattern Work in Trading?
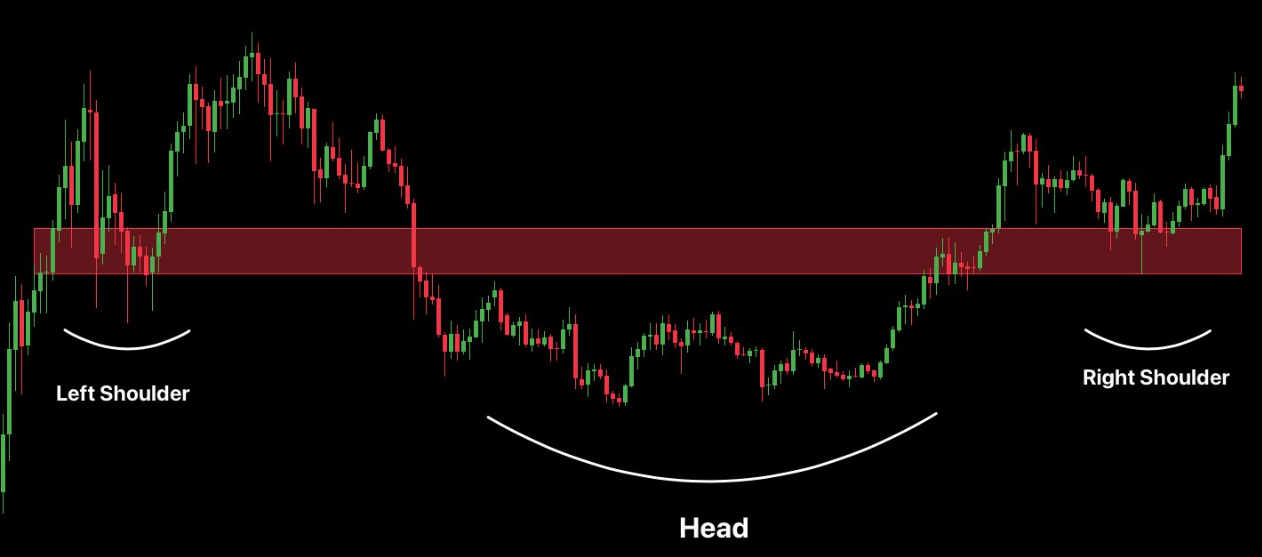
If you’ve ever wondered “How can I identify a Head and Shoulders pattern on a chart?” or “What does the Head and Shoulders pattern mean in trading?”, the answer lies in its structure. This pattern consists of three peaks:
- Left Shoulder – A price peak followed by a retracement.
- Head – A higher peak than the left shoulder, followed by another decline.
- Right Shoulder – A lower peak than the head, signaling weakening bullish momentum.
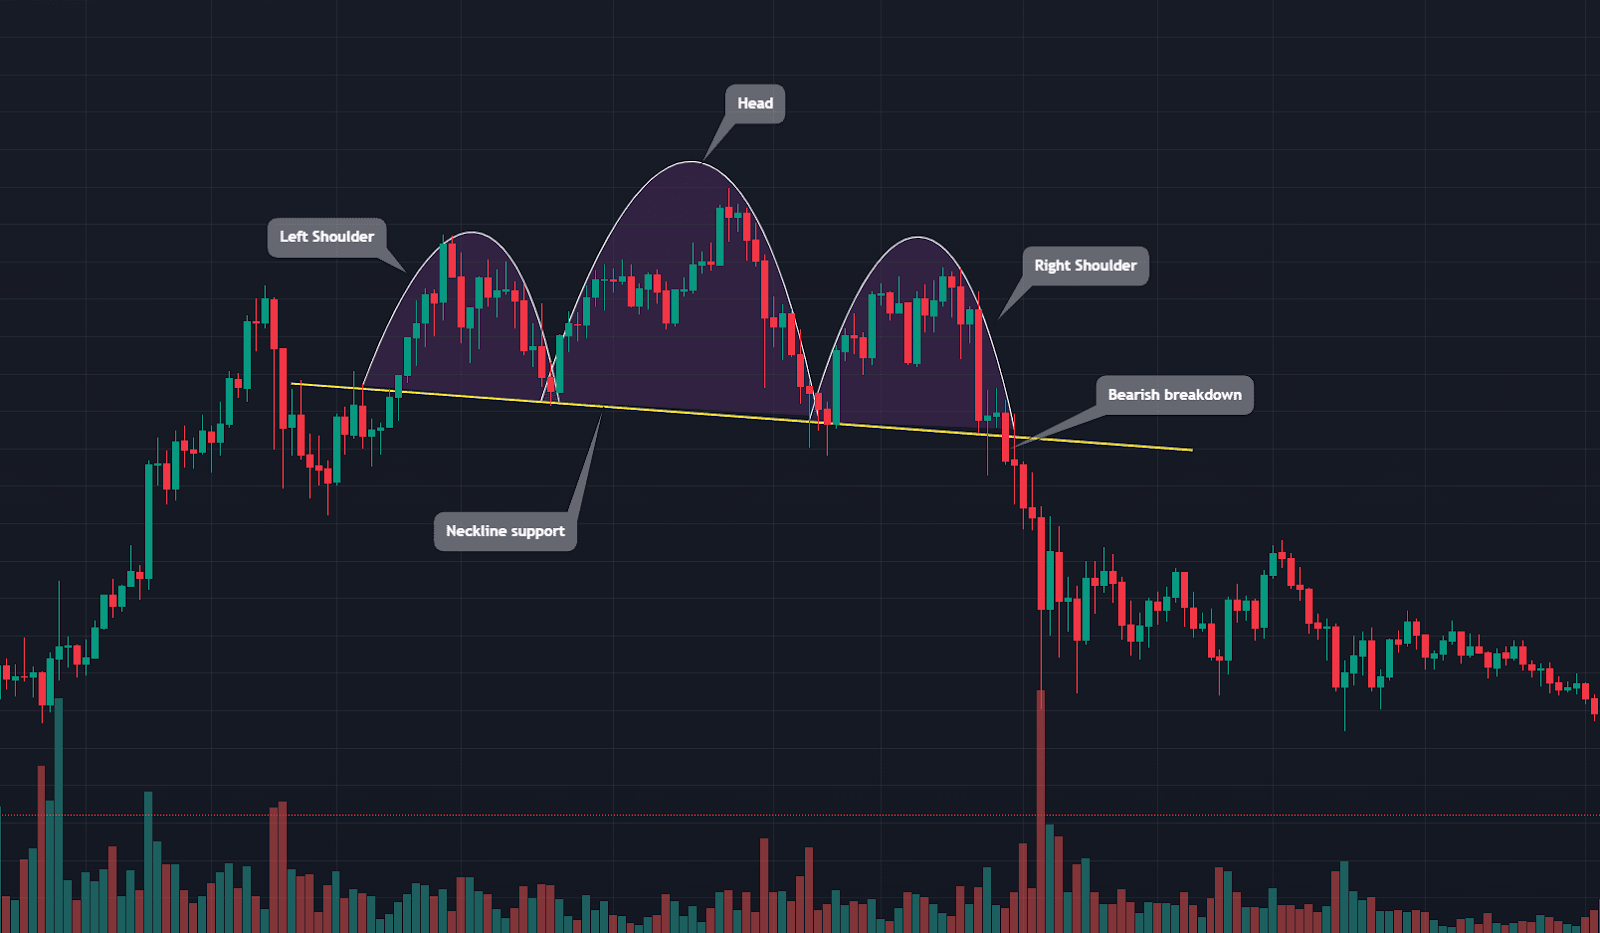
A horizontal or slightly sloped neckline connects the lows of the left shoulder and the head, acting as a key breakout level.
Once the price breaks below the neckline in a classic Head and Shoulders pattern (or above in an Inverse Head and Shoulders), it signals a trend reversal.
Variations of the Head and Shoulders Pattern
- Standard Head and Shoulders – Forms after an uptrend and signals a bearish reversal when the price breaks below the neckline.
- Inverse Head and Shoulders – Forms after a downtrend and signals a bullish reversal when the price breaks above the neckline.
- Complex Head and Shoulders – Features multiple peaks and shoulders, requiring additional confirmation before trading.
Head and Shoulders Pattern as a Market Signal
The Head and Shoulders pattern provides strong indications of trend reversals, but its significance depends on confirmation factors.
Standard Head and Shoulders (Bearish Reversal Signal)
- Forms after a sustained uptrend.
- The price fails to make new highs after forming the right shoulder.
- A break below the neckline confirms the pattern, often triggering a downtrend.
Inverse Head and Shoulders (Bullish Reversal Signal)
- Forms after a prolonged downtrend.
- The price makes higher lows, indicating strengthening buying pressure.
- A breakout above the neckline signals the start of an uptrend.
Confirmation: The Key to Head and Shoulders Trading Success
To reduce false signals, traders should confirm the Head and Shoulders pattern using:
- Volume Analysis – Increased volume during the neckline breakout adds credibility to the pattern.
- Neckline Retest – A retest of the neckline after a breakout offers an ideal entry point.
- Momentum Indicators – RSI, MACD, or Stochastic Oscillator can confirm trend weakening before the breakout.
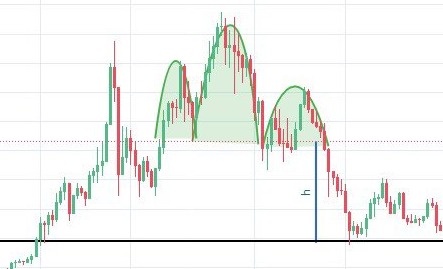
- Price Targets – The distance from the head to the neckline can help estimate the target price move after the breakout.
Why Context Matters
The effectiveness of the Head and Shoulders pattern depends on market conditions:
- A well-defined pattern in a high-liquidity market increases reliability.
- False breakouts can occur in choppy or low-volume conditions.
- Combining the pattern with trend analysis strengthens its accuracy.
Time Frames for Using the Head and Shoulders Pattern
The Head and Shoulders pattern appears across multiple time frames, making it versatile for different trading styles:
- Day Traders – Identify the pattern on intraday charts (e.g., 15-minute, 1-hour) for short-term opportunities.
- Swing Traders – Look for Head and Shoulders formations on daily charts to capture medium-term trend shifts.
- Position Traders – Spot patterns on weekly or monthly charts to anticipate long-term reversals.
Regardless of the time frame, confirmation is crucial before entering a trade.
Example: How to Use the Head and Shoulders Pattern in Trading
Imagine a stock has been in an uptrend and forms a clear Head and Shoulders pattern. Here’s how to trade it:
- Identify the left shoulder, head, and right shoulder formation.
- Draw the neckline connecting the low points between the peaks.
- Wait for a break below the neckline on increased volume to confirm a bearish trend reversal.
- Enter a short position after the breakdown or on a retest of the neckline.
- Set a stop-loss above the right shoulder to manage risk.
- Use the head-to-neckline distance to estimate the profit target.
This structured approach helps traders manage risk while capitalizing on potential reversals.
Limitations of Trading Based on the Head and Shoulders Pattern
Despite its reliability, the Head and Shoulders pattern has limitations:
- False Breakouts – The price may temporarily break the neckline and reverse back.
- Market Noise – In volatile markets, patterns may appear incomplete or misleading.
- Need for Confirmation – Relying solely on the pattern without additional indicators increases risk.
Traders should always use stop-loss orders and complementary analysis for better risk management.
Stay ahead of the market
with Tealstreet
Final Thoughts
The Head and Shoulders pattern is one of the most effective trend reversal tools in technical analysis. By confirming it with volume, neckline breaks, and momentum indicators, traders can enhance their accuracy and reduce false signals. Whether trading stocks, forex, or crypto, this pattern remains a staple for identifying high-probability market reversals.
Stay ahead of the market with Tealstreet. Take your head and shoulders for a ride on the fastest crypto trading interface ever.
Head and Shoulders Pattern FAQs
1. How can I identify a Head and Shoulders pattern on a chart?
Look for three peaks: a left shoulder, a higher head, and a lower right shoulder. The pattern is confirmed once the price breaks the neckline.
2. Is the Head and Shoulders pattern reliable?
Yes, but it requires confirmation from volume, neckline retests, and technical indicators to avoid false breakouts.
3. Can I use the Head and Shoulders pattern in all markets?
Yes, the pattern is applicable to stocks, forex, crypto, and commodities, though reliability varies with market conditions.
4. What is the best time frame for using the Head and Shoulders pattern?
It works across all time frames, but higher time frames (daily, weekly) tend to provide more reliable signals.
