
TL;DR Key Takeaways
TL;DR
- The inverted cup and handle pattern signals a potential bearish breakout, often forming after a failed bullish rally.
- To maximize accuracy, traders should confirm the inverted cup and handle with volume analysis, support breaks, and complementary indicators like the Relative Strength Index (RSI) or moving averages.
Spotting a bearish continuation in an uptrending market isn’t always straightforward. That’s where the inverted cup and handle pattern comes into play: with its distinct rounded-top and consolidation handle, it signals weakening bullish momentum and a possible downtrend.
In this article, we’ll explore how the pattern works, where it fits into a trading strategy, and how you can use it to your advantage. Without further ado, let’s dive into it.
How Does the Inverted Cup and Handle Pattern Work in Trading?
If you’ve ever wondered “How can I identify an inverted cup and handle pattern on a chart?” or “What does the inverted cup and handle pattern indicate?”, the answer is simple: It is a bearish continuation pattern that appears after a temporary uptrend and signals potential downward momentum.
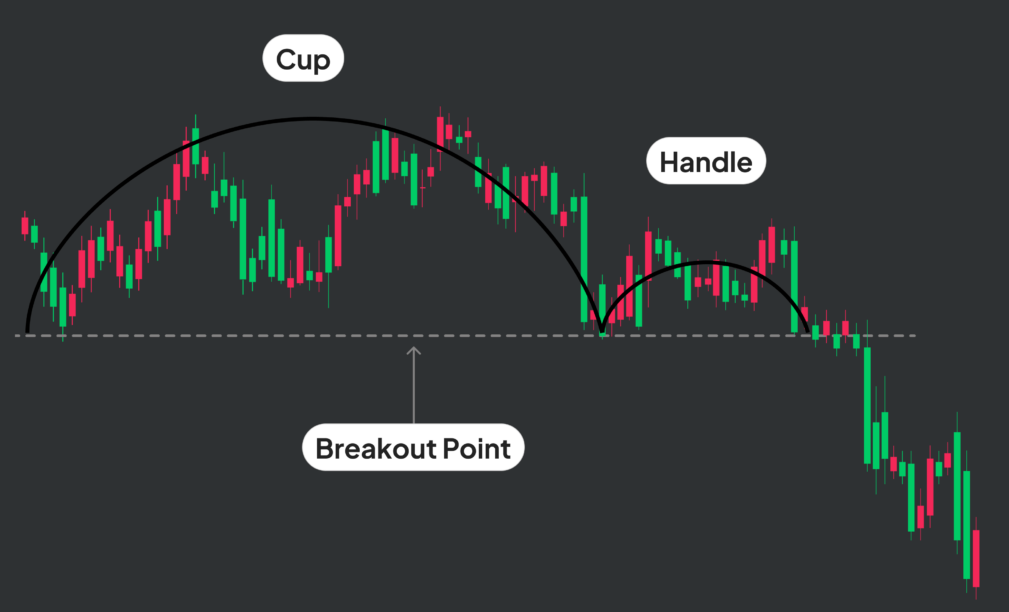
This pattern forms when a price rally slowly curves downward into a rounded top (the “cup”), followed by a small, short-lived upward consolidation (the “handle”). This dynamic suggests that sellers are gaining control, making it an important pattern for traders looking to capitalize on downward trends.
Appearance of an Inverted Cup and Handle Pattern
An inverted cup and handle pattern typically appears as an upside-down ‘U’ shape, followed by a small retracement before the price continues downward.
Key Characteristics:
- Rounded Top (Cup): A steady decline following a peak, forming a rounded price action.
- Handle Formation: A small retracement or consolidation, often resembling a flag or wedge pattern.
- Breakout Point: A sharp move downward after the handle, confirming the pattern’s bearish intent.
This structure represents an uptrend losing steam, with sellers eventually overpowering buyers, leading to a breakdown.
Inverted Cup and Handle Pattern as a Market Signal
The inverted cup and handle is a classic bearish continuation pattern, particularly during an existing downtrend. However, it’s important to note that it is most reliable when forming near a resistance level or as part of a broader downtrend.
The probability of a successful breakdown increases if the handle forms with low volume, indicating weak buying pressure. Conversely, a sudden increase in volume when breaking the support confirms selling momentum.
Confirmation: The Key to Inverted Cup and Handle Trading Success
Confirmation is crucial when trading the inverted cup and handle. Traders typically wait for the price to break below the support level of the handle with significant volume. Without this follow-up move, the pattern might be a false signal.
Confirmation Strategies:
- Volume Analysis: A surge in selling volume during the breakdown adds credibility.
- Support Level Break: If the price drops below the handle’s support, it signals a strong bearish move.
- Additional Indicators: RSI crossing into oversold territory or moving averages confirming a downtrend strengthen the signal.
Why Context Matters
No trader should rely solely on the inverted cup and handle pattern. Incorporating trend analysis, support and resistance levels, and momentum indicators can significantly improve the pattern’s reliability.
For example, if an inverted cup and handle forms near a major resistance level, it suggests a strong rejection and increases the chances of a downward continuation. However, if it appears in an uptrend with high bullish momentum, it might be a temporary pullback rather than a true reversal.
Time Frames for Using the Inverted Cup and Handle Pattern
The inverted cup and handle pattern can appear across various time frames, from short-term intraday charts to long-term weekly and monthly charts.
- Day traders might spot an inverted cup and handle in crypto or forex charts while scalping.
- Swing traders could identify the pattern on daily or weekly charts, using longer confirmation periods before entering a trade.
- Position traders may use the pattern on higher time frames for long-term bearish setups.
Regardless of the time frame, the principle remains the same: an uptrend losing momentum, followed by a retracement and a downward breakout.
Example: How to Use the Inverted Cup and Handle in Trading
Scenario:
Imagine a cryptocurrency experiencing a strong rally but beginning to lose steam around a significant resistance level. The price starts to round off, forming the cup. After this, a brief bullish retracement (the handle) appears, but it struggles to gain traction.
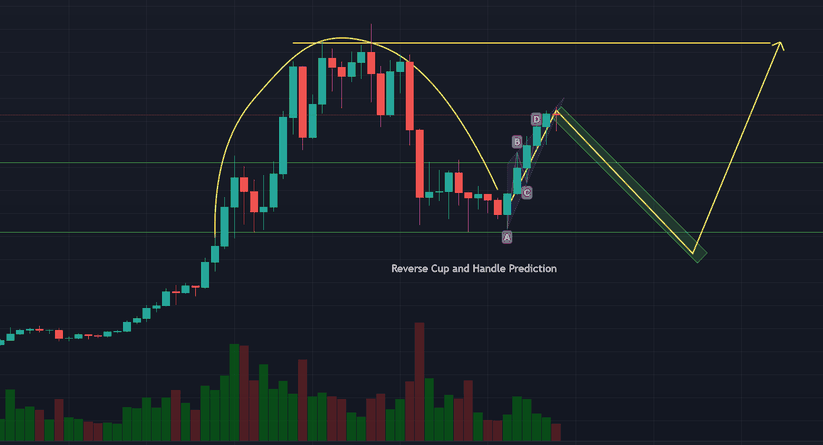
To confirm the pattern:
- The price breaks below the handle’s support level.
- Selling volume surges.
- The RSI trends downward, confirming bearish momentum.
Traders might enter a short position upon the breakout, setting a stop-loss above the handle’s high and a take-profit at the next support zone.
Limitations of Trading Based on the Inverted Cup and Handle
While the inverted cup and handle pattern is a valuable tool, it is not foolproof. False signals can occur, especially in choppy or sideways markets.
Potential Pitfalls:
- False Breakouts: The price may briefly break support before reversing.
- Low Volume Moves: If the breakdown happens on low volume, the signal is weaker.
- Strong Uptrends: The pattern is less effective in strongly bullish conditions.
To mitigate these risks, it’s best to combine the inverted cup and handle with other technical and fundamental analysis tools.
Inverted Cup and Handle Pattern vs. Traditional Cup and Handle
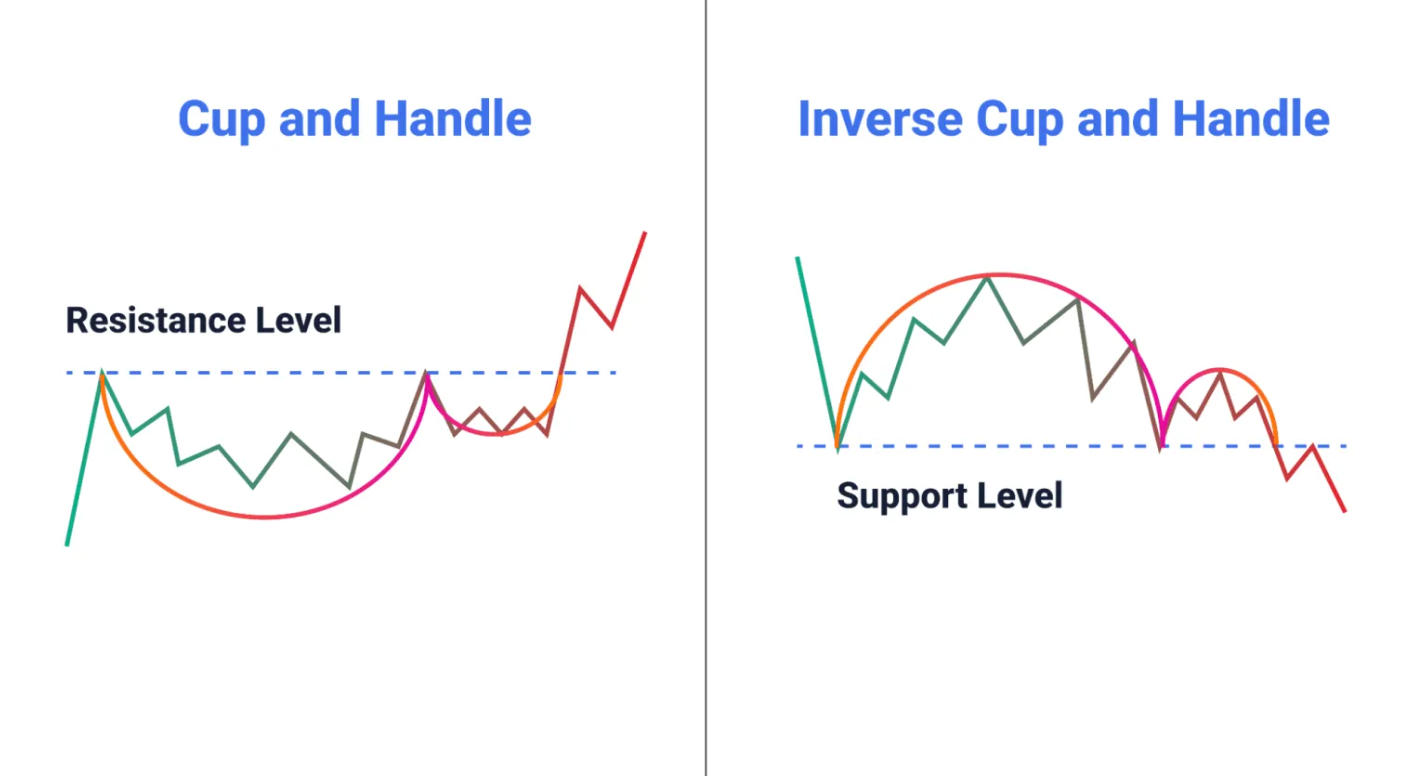
While both the inverted cup and handle and the traditional cup and handle patterns are useful in technical analysis, they have key differences:
- Inverted Cup and Handle: Signals a bearish continuation after a failed rally.
- Traditional Cup and Handle: Signals a bullish continuation after a temporary consolidation.
Understanding these distinctions helps traders choose the right strategy for prevailing market conditions.
What Type of Trading Strategy Suits the Inverted Cup and Handle?
The inverted cup and handle pattern is best suited for momentum-based and trend-following strategies, particularly in bearish markets. Traders often use it in combination with:
- Breakout trading – Entering short positions after a confirmed support break.
- Swing trading – Capturing medium-term moves within a broader downtrend.
- Trend-following – Using moving averages to confirm bearish momentum.
Stay ahead of the market
with Tealstreet
Final Thoughts
The inverted cup and handle pattern is a powerful bearish continuation signal, but traders must confirm it with volume, support breaks, and complementary indicators. When used correctly, it provides valuable insights into potential market breakdowns.
Ready to enhance your trading? Tealstreet offers fast execution, intuitive controls, and advanced analytics to help you trade where you are.
Inverted Cup and Handle FAQs
1. How can I identify an Inverted Cup and Handle on a chart?
The Inverted Cup and Handle pattern consists of a rounded top (the "cup") followed by a smaller upward retracement (the "handle"). It typically forms after an uptrend and signals a potential bearish continuation. Traders look for a breakdown below the handle’s support level as confirmation.
2. How reliable is the Inverted Cup and Handle for predicting market moves?
The pattern is considered a strong bearish continuation signal, especially when accompanied by high volume during the breakdown. However, like all technical patterns, it requires confirmation through price action, volume, and other indicators to improve reliability.
3. Can the Inverted Cup and Handle be used in all markets (stocks, forex, crypto)?
Yes, the pattern is applicable across various markets, including stocks, forex, and cryptocurrency. It works well in assets that exhibit clear trends and sufficient liquidity for technical analysis.
4. What are the ideal conditions or confirmations to validate an Inverted Cup and Handle?
Ideal confirmations include:
- A breakdown below the handle’s support level.
- Increased volume during the breakdown.
- Bearish signals from complementary indicators like the Relative Strength Index (RSI) or Moving Averages.
- Formation near a key resistance level for added confluence.
What timeframes work best for using the Inverted Cup and Handle?
The pattern can appear on various timeframes, from intraday charts (e.g., 15-minute or 1-hour) to longer-term daily and weekly charts. However, higher timeframes (daily or weekly) tend to provide more reliable signals, reducing the likelihood of false breakouts.
