
TL;DR Key Takeaways
TL;DR
- The Wedge pattern signals a potential continuation or reversal, depending on its formation and breakout direction.
- To maximize accuracy, traders should confirm the pattern with volume analysis, breakout confirmation, and complementary indicators like RSI or moving averages.
Spotting market trends early is essential for traders looking to capitalize on price movements. The Wedge pattern is one of the most effective tools for identifying consolidations before breakouts. In this article, we’ll explore how the Wedge pattern works, its variations, and how traders can effectively incorporate it into their strategy. Let’s dive in.
How Does the Wedge Pattern Work in Trading?
If you’ve ever wondered “How can I identify a Wedge pattern on a chart?” or “What does the Wedge pattern mean in trading?”, the answer lies in its structure. The Wedge pattern forms when price movements tighten between two converging trendlines, signaling a potential breakout.
The pattern consists of:
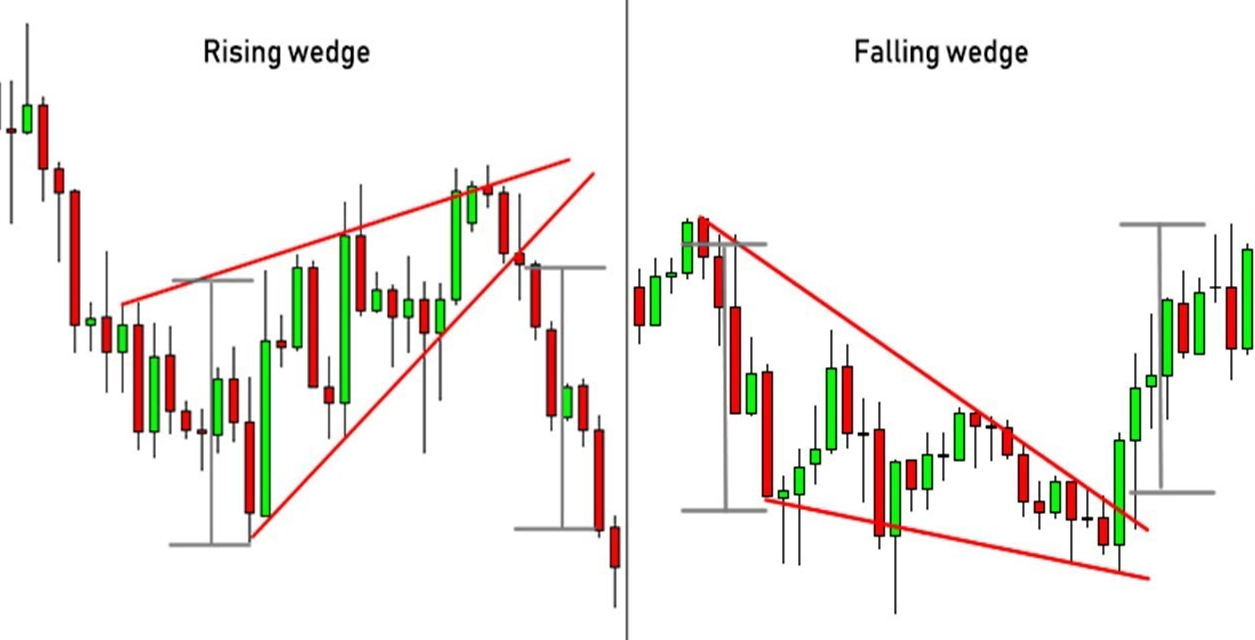
- Rising Wedge – A bearish pattern that forms when price consolidates upward within converging trendlines before breaking downward.
- Falling Wedge – A bullish pattern that forms when price consolidates downward before breaking upward.
A breakout from the Wedge pattern confirms the new trend direction, making it a powerful signal for traders.
Variations of the Wedge Pattern
- Rising Wedge – A bearish continuation or reversal pattern forming after an uptrend, signaling a breakdown once support is lost.
- Falling Wedge – A bullish continuation or reversal pattern forming after a downtrend, signaling an upward breakout when resistance is breached.
Large vs. Small Wedges – Larger wedge formations indicate stronger potential price movements, while smaller wedges may lead to minor corrections.
Wedge Pattern as a Market Signal
The Wedge pattern provides traders with insight into trend continuations or reversals. However, context and confirmation are essential.
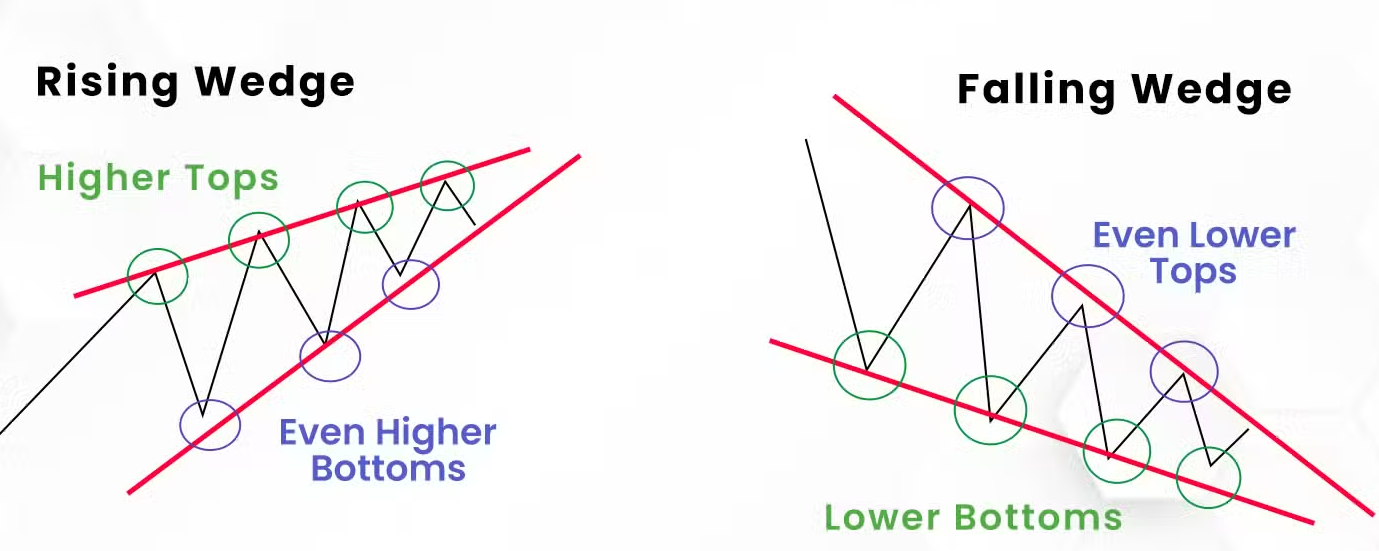
Rising Wedge (Bearish Signal)
- Forms after an uptrend or within an ongoing trend.
- The price makes higher highs and higher lows but starts to contract.
- A breakdown below the lower trendline signals a bearish move.
Falling Wedge (Bullish Signal)
- Forms after a downtrend or during consolidation.
- The price makes lower highs and lower lows but starts tightening.
- A breakout above the upper trendline confirms a bullish move.
Confirmation: The Key to Wedge Pattern Trading Success
To reduce false signals, traders should confirm the Wedge pattern using:
- Volume Analysis – A breakout with high volume reinforces the pattern’s validity.
- Breakout Retest – A retest of the breakout level strengthens confirmation.
- Momentum Indicators – RSI, MACD, or Stochastic Oscillator can confirm market momentum before a breakout.
- Trend Context – Identifying whether the Wedge forms within a broader trend improves reliability.
Why Context Matters
Trading the Wedge pattern in isolation can lead to false signals. Here’s why context is crucial:
- The pattern is more effective when aligned with major support or resistance zones.
- Breakout direction determines whether the pattern signals continuation or reversal.
- Combining the pattern with broader market analysis improves trade accuracy.
Time Frames for Using the Wedge Pattern
The Wedge pattern appears across multiple time frames, making it versatile for different trading styles:
- Day Traders – Identify the pattern on short-term charts (e.g., 5-minute, 15-minute) for quick trades.
- Swing Traders – Use the Wedge pattern on daily charts to capture medium-term breakouts.
- Position Traders – Look for Wedge formations on weekly or monthly charts to anticipate long-term trend shifts.
Regardless of the time frame, waiting for confirmation before entering a trade is crucial.
Example: How to Use the Wedge Pattern in Trading
Imagine a stock has been in a downtrend and forms a Falling Wedge pattern. Here’s how to trade it:
- Identify the lower highs and lower lows forming within converging trendlines.
- Draw the trendlines connecting highs and lows to visualize the pattern.
- Wait for a breakout above the upper trendline on strong volume to confirm a bullish reversal.
- Enter a long position after confirmation.
- Place a stop-loss below the lowest point of the Wedge pattern to manage risk.
- Set a profit target based on the height of the Wedge projected upward from the breakout.
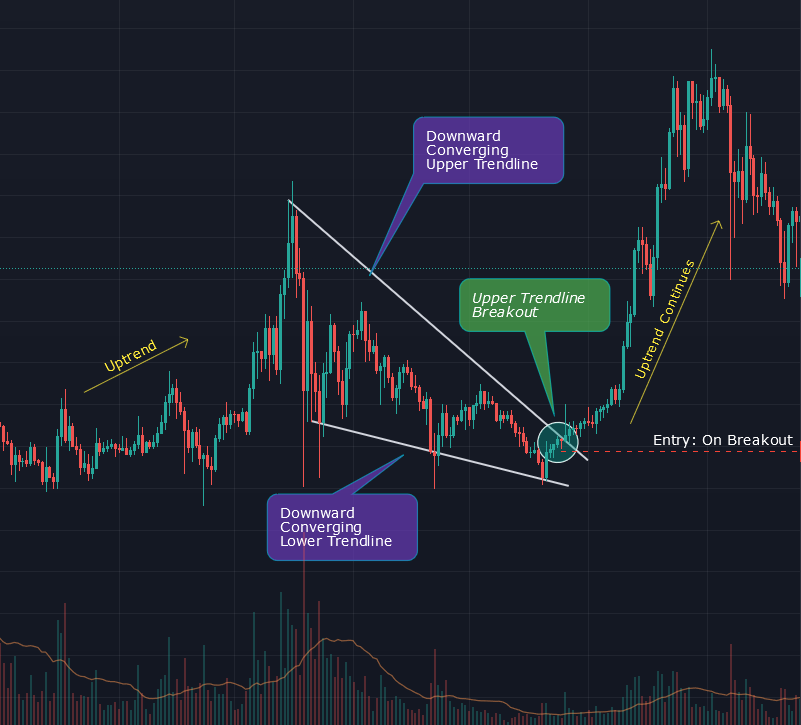
This structured approach helps traders manage risk while maximizing profit potential.
Limitations of Trading Based on the Wedge Pattern
Despite its effectiveness, the Wedge pattern has limitations:
- False Breakouts – The price may temporarily break out and reverse back.
- Market Noise – In volatile markets, Wedge formations may be less reliable.
- Need for Confirmation – Relying solely on the pattern without volume or trend analysis increases risk.
Using additional indicators and stop-loss orders can help mitigate these risks.
Final Thoughts
The Wedge pattern is a valuable tool in technical analysis for identifying breakouts and trend reversals. By confirming it with volume, breakout direction, and technical indicators, traders can improve their accuracy and reduce false signals. Whether trading stocks, forex, or crypto, this pattern provides high-probability trade setups when used correctly.
Ready to enhance your trading? Tealstreet offers fast execution, intuitive controls, and advanced analytics to help you trade where you are.
Stay ahead of the market
with Tealstreet
Wedge Pattern FAQs
1. How can I identify a Wedge pattern on a chart?
Look for converging trendlines with price tightening inside the pattern. A breakout confirms the pattern’s validity.
2. Is the Wedge pattern reliable?
Yes, but it requires confirmation from volume, breakout retests, and momentum indicators to avoid false signals.
3. Can I use the Wedge pattern in all markets?
Yes, the pattern applies to stocks, forex, crypto, and commodities, though reliability varies with market conditions.
4. What is the best time frame for using the Wedge pattern?
It works across all time frames, but higher time frames (daily, weekly) tend to provide more reliable signals.
