
TL;DR Key Takeaways
TL;DR
- Support and resistance are key price levels where buying or selling pressure tends to stop or reverse market trends.
- Traders confirm support and resistance levels using historical price data, moving averages, trendlines, and volume analysis to improve accuracy.
Recognizing price levels where assets tend to reverse or consolidate is crucial for traders. That’s where support and resistance come into play. These levels help traders make informed entry and exit decisions. In this article, we’ll break down what support and resistance are, how to identify them, and how they fit into trading strategies. Let’s dive in.
How Do Support and Resistance Work in Trading?
If you’ve ever wondered “How can I identify support and resistance on a chart?” or “What is the significance of these levels?”, the answer isn’t as complicated as it seems.
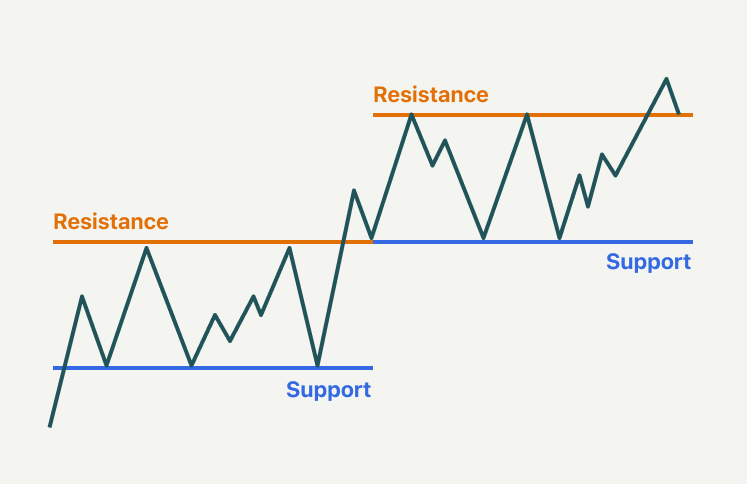
Support and resistance are horizontal or trend-based price levels where markets tend to stall or reverse.
- Support: A price level where buying pressure absorbs selling pressure, preventing the price from falling further.
- Resistance: A price level where selling pressure overcomes buying pressure, preventing the price from rising further.
These levels emerge due to historical price behavior, psychological factors, and institutional trading activity.
Appearance of Support and Resistance
Support Levels
Support appears as a horizontal line or trendline drawn across previous market lows where price tends to bounce.
Key Characteristics:
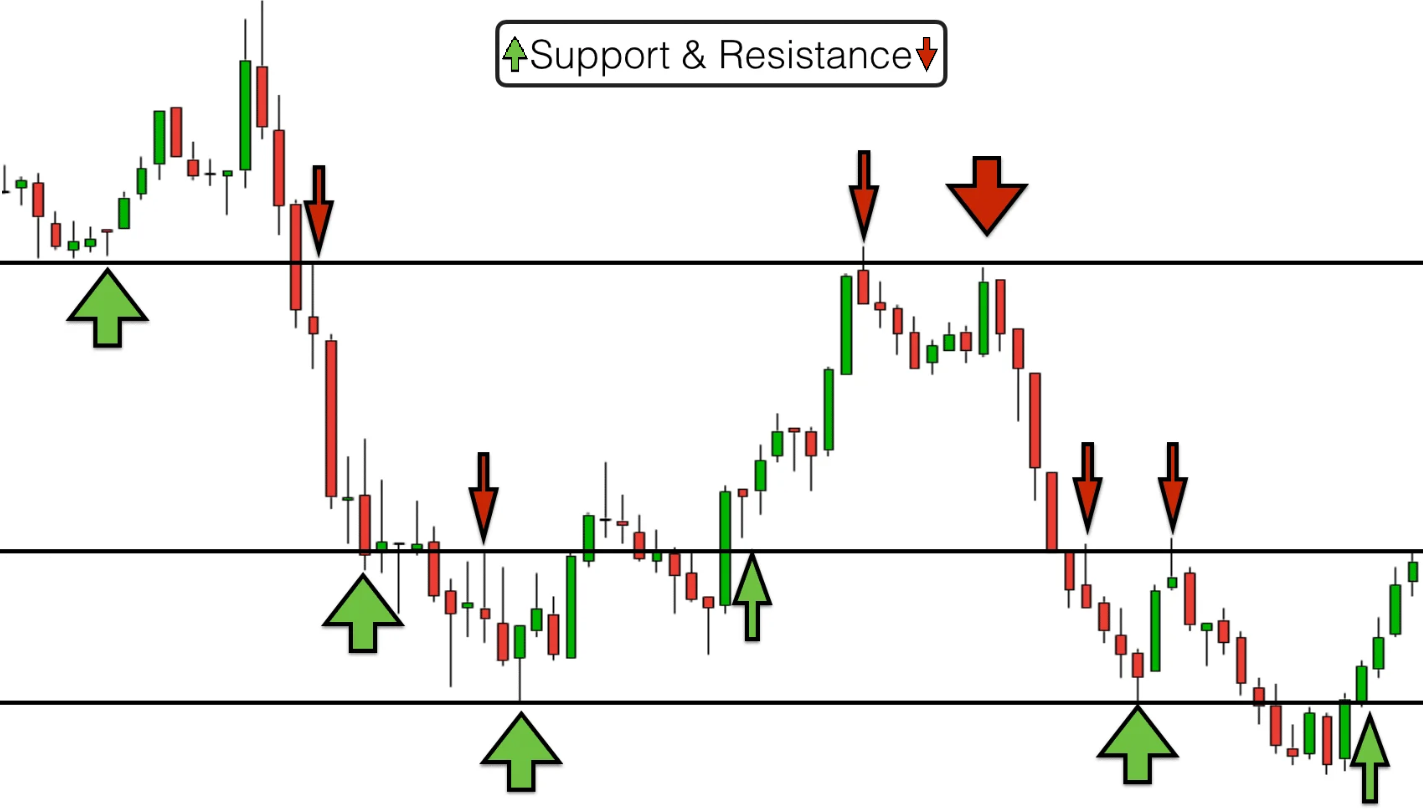
- Prices approach the level and tend to reverse upwards.
- Volume often increases when the price nears support.
- The more times a level is tested without breaking, the stronger it becomes.
Resistance Levels
Resistance appears as a horizontal line or trendline drawn across previous market highs where price tends to drop.
Key Characteristics:
- Prices approach the level and tend to reverse downwards.
- Resistance often aligns with previous swing highs.
Strong resistance levels lead to trend reversals if price fails to break through.
Support and Resistance as Market Signals
Support and resistance levels act as decision points for traders. When prices approach these levels, they can either:
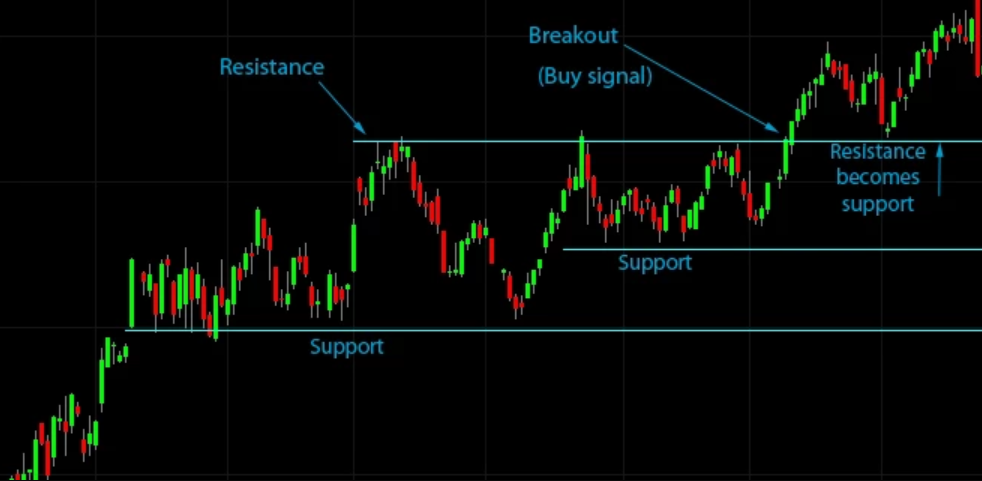
- Bounce off and continue within a range.
- Break through, signaling a potential trend continuation.
In an uptrend, support levels provide buying opportunities on pullbacks.
In a downtrend, resistance levels offer selling opportunities on price retracements.
Confirmation: The Key to Support and Resistance Trading
Confirmation is crucial when using support and resistance. Traders usually wait for:
- A reversal candlestick pattern (e.g., hammer, engulfing) at a key level.
- Increased trading volume to confirm market interest.
- Break-and-retest behavior before entering a trade.
Without confirmation, false breakouts can lead to losses.
Why Context Matters
Support and resistance should not be used in isolation. Other factors to consider:
- Market trend: A resistance in a strong uptrend might eventually break.
- Timeframe: Support and resistance on higher timeframes are more reliable.
Indicators: RSI, moving averages, and Bollinger Bands help validate these levels.
Time Frames for Using Support and Resistance in Trading
Support and resistance appear across all time frames:
- Intraday traders use them on 5-minute and 15-minute charts.
- Swing traders analyze them on daily and weekly charts.
- Long-term investors focus on monthly and yearly levels.
Higher time frame levels tend to be stronger and more reliable.
Example: How to Use Support and Resistance in Trading
Imagine Bitcoin is trading at $30,000, a level where price previously bounced. As price approaches this level again, traders:
- Look for confirmation (e.g., bullish candlestick pattern at support).
- Check volume to ensure strong buying interest.
- Enter a long trade with a stop-loss below support.
- Take profit at the next resistance level.
Limitations of Trading Based on Support and Resistance
While support and resistance are powerful tools, they’re not foolproof. Some challenges include:
- False breakouts: Price may temporarily breach a level before reversing.
- Changing market conditions: Strong support today can break tomorrow.
- Over-reliance: Using them alone without other confirmations increases risk.
To mitigate these risks, traders should combine support and resistance with technical indicators and risk management strategies.
Support and Resistance vs. Trendlines
While both are used to identify price movement, they differ:
- Support and Resistance: Horizontal levels based on historical highs/lows.
- Trendlines: Diagonal lines showing market direction.
Both are valuable and can be used together for more precise analysis.
What Type of Trading Strategy Suits Support and Resistance?
Support and resistance fit various trading styles:
- Day trading: Quick scalping around these levels.
- Swing trading: Holding trades from support to resistance.
- Breakout trading: Entering trades when price decisively breaks a level.
Traders use risk management techniques to minimize potential losses.
Stay ahead of the market
with Tealstreet
Final Thoughts
This article explored how support and resistance help traders identify key price areas and make informed trading decisions. You’ve learned how to spot these levels, confirm them, and integrate them into a strategy.
Ready to enhance your trading? Tealstreet offers fast execution, intuitive controls, and advanced analytics to help you trade smarter.
Support and Resistance FAQs
1. How can I identify support and resistance on a chart?
Look for areas where price has previously reversed multiple times. Use trendlines, moving averages, and volume for confirmation.
2. How reliable are support and resistance levels?
Higher time frames offer more reliable levels, but no support or resistance is invincible.
3. Can support and resistance be used in all markets?
Yes, they apply to stocks, forex, crypto, and commodities.
4. What are the ideal confirmations for support and resistance trades?
Look for reversal candlestick patterns, volume spikes, and moving average confluence.
5. What timeframes work best for support and resistance trading?
It depends on the trading style—intraday traders use short time frames, while swing traders focus on daily or weekly charts.
